

YRBSS Participation Maps & History
 ShareCompartir
Current Participation Maps and Participation History
- High School Participation Map
- Middle School Participation Map
- YRBSS Participation History & Data Quality
2015 High School YRBS Participation Map
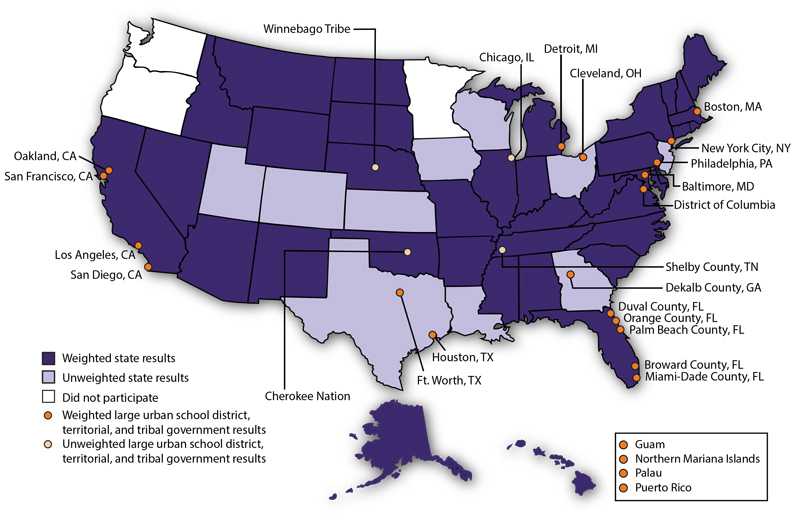
This map illustrates state, territory, tribal government, and large urban school district participation in the 2015 High School Youth Risk Behavior Survey. Weighted and unweighted state, territory, tribal government, and large urban school district surveys are shown.
Weighted State Surveys
| Alabama Alaska Arizona Arkansas California Connecticut Delaware Florida Hawaii Idaho |
Illinois Indiana Kentucky Maine Maryland Massachusetts Michigan Mississippi Missouri |
Montana Nebraska Nevada New Hampshire New Mexico New York North Carolina North Dakota Oklahoma |
Pennsylvania Rhode Island South Carolina South Dakota Tennessee Vermont Virginia West Virginia Wyoming |
Note: Minnesota, Oregon, and Washington did not participate in the YRBS in 2015.
Weighted Territorial Surveys
| Guam Northern Mariana Islands Palau Puerto Rico |
Weighted Large Urban School District Surveys
| Baltimore, MD Boston, MA Broward County, FL Cleveland, OH Dekalb County, GA Detroit, MI |
District of Columbia Duval County, FL Fort Worth, TX Houston, TX Los Angeles, CA Miami-Dade County, FL |
New York City, NY Oakland, CA Orange County, FL Palm Beach County, FL Philadelphia, PA San Diego, CA San Francisco, CA |
1 Weighted results means that the overall response rate was at least 60%. Weighted results are representative of all students in grades 9–12 attending public schools (and in some cases, public and private schools) in each jurisdiction. With weighted data, it is possible to say, for example, “X% of students in state Y never or rarely wore a seat belt when riding in a car driven by someone else.”
2 Unweighted data represent only the students who completed the survey. The following states, large urban school districts, and tribal governments participated in the YRBS in 2015 and did not obtain weighted data: Colorado, Georgia, Iowa, Kansas, Louisiana, New Jersey, Ohio, Texas, Utah, Wisconsin, Chicago, IL, Shelby County, TN, Cherokee Nation, and Winnebago Tribe.
2015 Middle School YRBS Participation Map
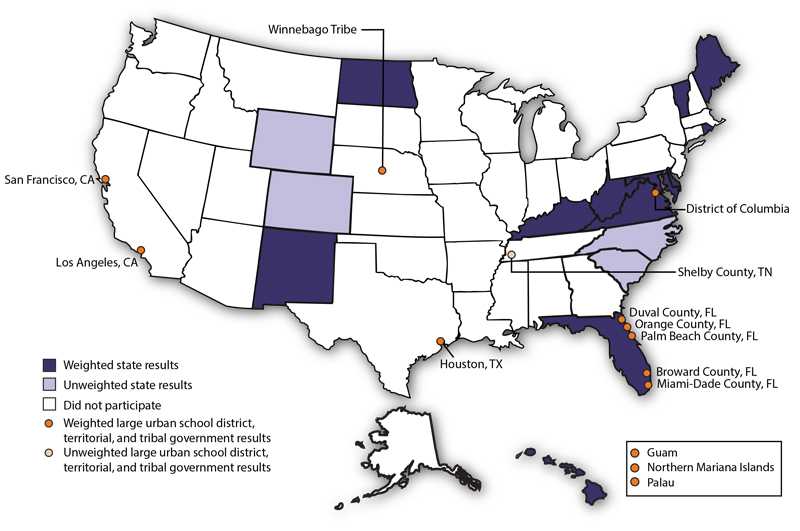
This map illustrates state, territory, tribal government, and large urban school district participation in the 2015 Middle School Youth Risk Behavior Survey. Weighted1 and unweighted2 state, territory, tribal government, and large urban school district surveys are shown.
Weighted State Surveys
| Delaware Florida Hawaii Kentucky |
Maine Maryland New Mexico North Dakota |
Rhode Island Vermont Virginia West Virginia |
Weighted Territorial Surveys
| Guam Northern Mariana Islands Palau |
Weighted Tribal Government Surveys
| Winnebago Tribe |
Weighted Large Urban School District Surveys
| Broward County, FL District of Columbia Duval County, FL |
Houston, TX Los Angeles, CA Miami-Dade County, FL |
Orange County, FL Palm Beach County, FL San Francisco, CA |
1. Weighted results means that the overall response rate was at least 60%. Weighted results are representative of all students in grades 6–8 attending public schools (and in some cases, public and private schools) in each jurisdiction. With weighted data, it is possible to say, for example, “X% of students in state Y never or rarely wore a seat belt when riding in a car driven by someone else.”
2. Unweighted data represent only the students who completed the survey. The following states and large urban school districts participated in the YRBS in 2015 and did not obtain weighted data: Colorado, North Carolina, South Carolina, Wyoming, and Shelby County, TN.
- Page last reviewed: August 9, 2017
- Page last updated: August 9, 2017
- Content source: