

Epi Info™ User Guide - Companion for Android
 ShareCompartir
Epi Info™ User Guide
Collecting & Analyzing Data on an Android Device
StatCalc Epidemiologic Calculators
The StatCalc tool is a calculator capable of analysis pre and post data collection. The version available on the Companion for Android has similar functionality to the full Epi Info™ StatCalc tool and is capable of performing the analyses listed in the StatCalc menu listed below.
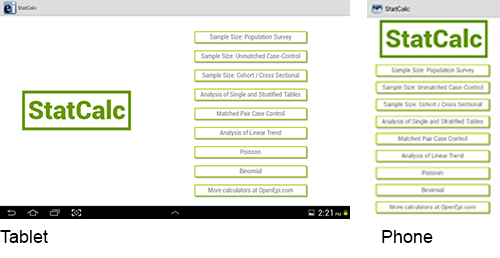
Figure 6.44: StatCalc main menu
For additional information regarding StatCalc, reference the StatCalc section of the user guide.
- Population Survey
- Unmatched Case-Control
- Cohort/Cross Sectional
- Analysis of Tables
- Matched Pair Case-Control
- Analysis of Linear Trend
- Poisson
- Binomial
- OpenEpi.com
Sample Size: Population Survey
The population survey calculates how many samples are recommended for a survey given a population size, expected frequency, design effect, the number of clusters and the desired confidence level.
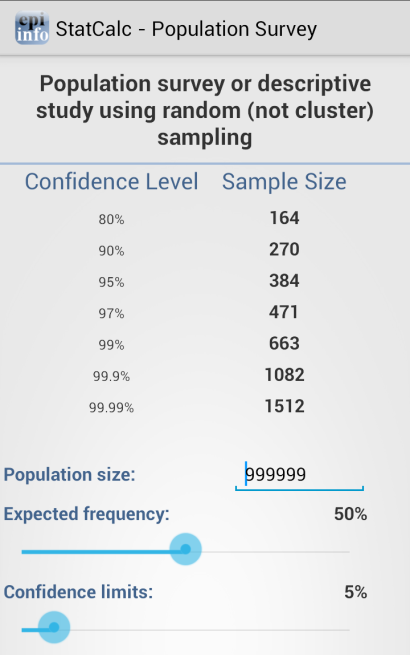
Figure 6.45: Population Survey
Sample Size: Unmatched Case-Control
The Unmatched Case Control study calculates how many samples are recommended for a study given the power, proportion of unexposed vs. exposed, percentage outcome in exposed group, percentage outcome in the unexposed group, and the desired confidence level.
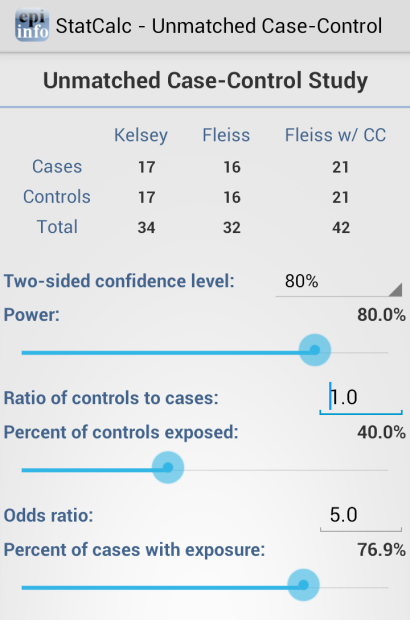
Figure 6.46: Unmatched Case-Control
Sample Size: Cohort / Cross Sectional
The Unmatched Cohort / Cross Section study calculates the sample size requirements for two groups that meet a set of research conditions: one group has a certain outcome (e.g., ill) or condition and other does not (e.g., not ill) based on a set of factors chosen by the researcher (e.g. confidence level, power (1 – α), ratio of exposed to unexposed, risk ratio, odds ratio, etc).
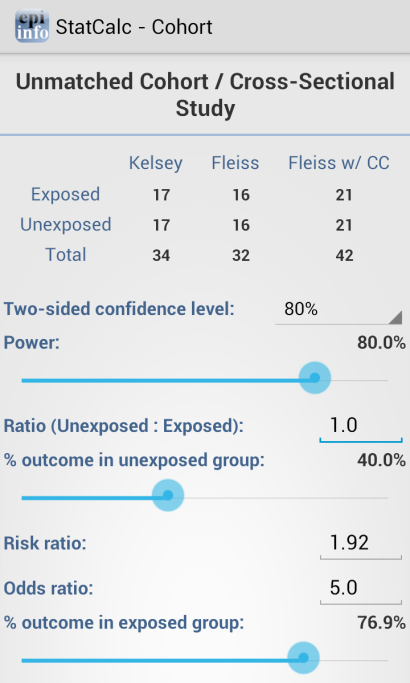
Figure 6.47: Cohort/Cross Sectional
Analysis of Single and Stratified Tables
2 x 2 tables are frequently used in epidemiology to explore associations between exposures to risk factors and disease or other outcomes. The table in StatCalc has Exposure on the left and Outcome across the top. Given a yes-no or other two-choice response describing disease and another describing exposure to a risk factor, StatCalc produces several kinds of statistics that test for relationships between exposure and disease.
Stratifying a dataset separates the population into distinct categories based on a parameter (i.e. sex). If confounding is present, associations between disease and exposure can be missed or falsely detected.
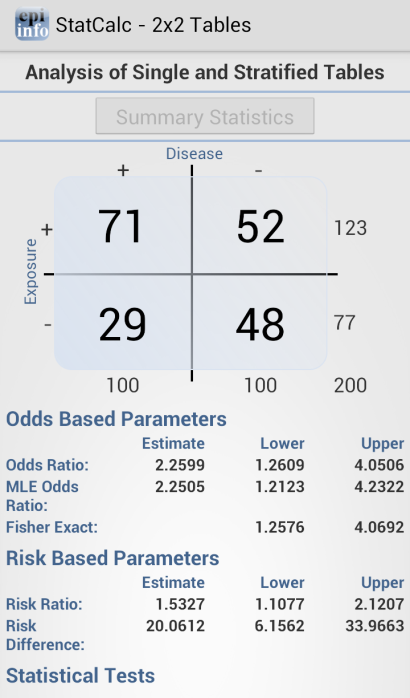
Figure 6.48: Single and Stratified Tables
Matched Pair Case-Control
The Matched Pair Case-Control Study calculates the statistical relationship between exposures and the likelihood of becoming ill in a given patient population. This study is used to investigate a cause of an illness by selecting a non-ill person as the control and matching the control to a case. The control can be matched to one or more criteria.
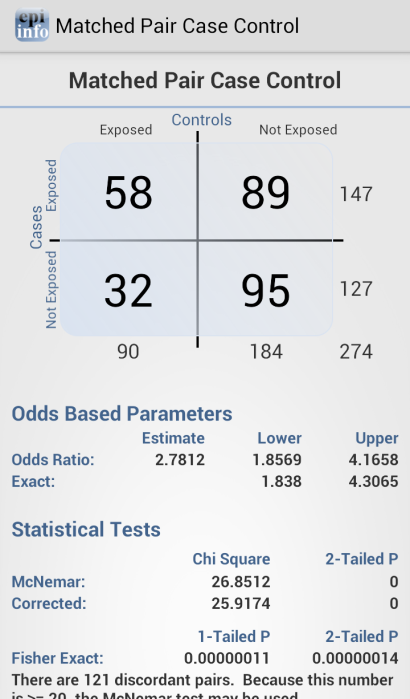
Figure 6.49: Match Pair Case Control
Analysis of Linear Trend
The Linear Trend function calculates the odds ratio, chi square for linear trend, and p-value statistics based on the response to an exposure score and whether or not the patient has become ill. The exposure score is a measured outcome from a study that states the level of exposure the patient received.
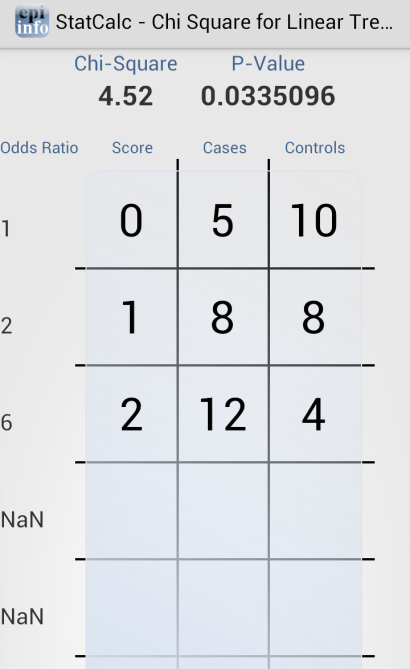
Figure 6.50: Analysis of Linear Trend
Poisson
The Poisson distribution states the probability that a number of positive outcomes occurs based on the expected number of positive outcomes. To analyze the Poisson distribution, enter the expected number of positive outcomes in Expected # of events and the value of positive outcomes you would like to determine the probability of in Observed # of events.
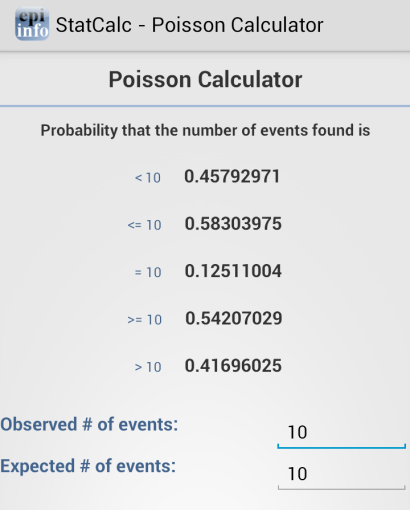
Figure 6.51: Poisson Distribution
Binomial
The binomial distribution states the probability that a number of positive outcomes occurs given the expected percentage of positive outcomes and the total number of observations taken.
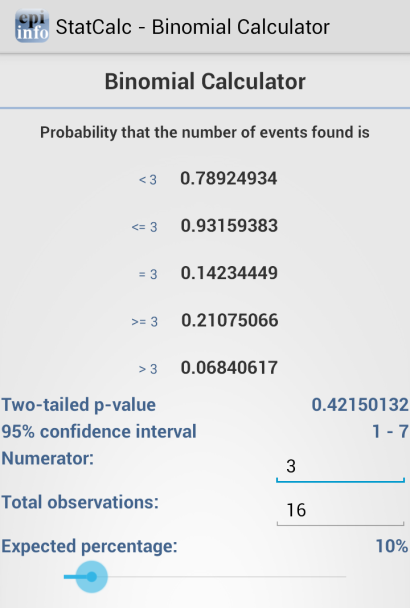
Figure 6.52: Binomial Distribution
OpenEpi.com
The OpenEpi.com website is an open source web tool that provides additional epidemiologic statistics.

Figure 6.53: OpenEpi.com
- Page last reviewed: June 27, 2017
- Page last updated: June 27, 2017
- Content source: