

Epi Info™ User Guide - Companion for Android
 ShareCompartir
Epi Info™ User Guide
Collecting & Analyzing Data on an Android Device
Analyze Data
The Analyze Data tool contains three commonly used analysis functions from the Visual Dashboard tool. For additional functionality, transfer the data to a PC and use the Epi Info™ Visual Dashboard tool (refer to Visual Dashboard section of the user guide).
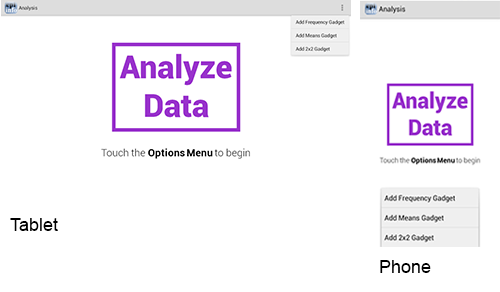
Figure 6.54: Analyze Data main menu
Note: The location of the options menu varies depending on the device.
Means Gadget
The Means gadget calculates the average for a continuous numeric variable. Mean, Variance, Standard deviation, Median, Minimum and Maximum values are calculated.
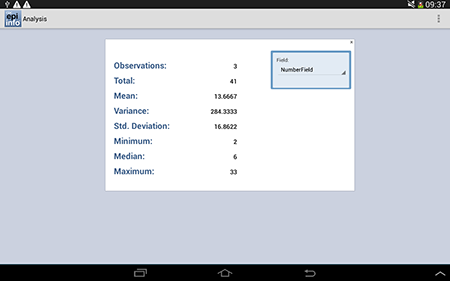
Figure 6.55: Means Gadget
Frequency Gadget
The Frequency gadget counts each occurrence in a category for a specified variable and gives the absolute and relative frequencies for each category. This option then produces a frequency table that shows how many records have a value for each variable, the percentage of the total, a cumulative percentage and upper and lower confidence intervals.
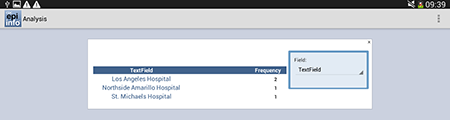
Figure 6.56: Frequency Gadget
2×2 Gadget
In epidemiology, 2 x 2 tables are frequently used to examine the relationship between two or more categorical values. In these tables, usually an “exposure” variable is considered the risk factor. The outcome variable is considered the disease of consequence. (e.g. the person had the disease or outcome of interest or they did not). Values of the first variable will appear on the left margin of the table, and those of the second will be across the top of the table. Normally, cells contain counts of records matching the values in corresponding marginal labels.
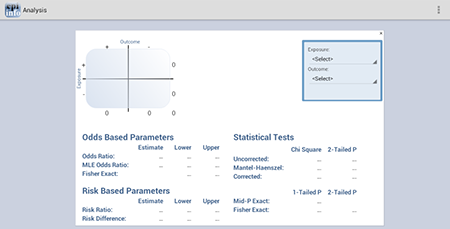
Figure 6.57: 2×2 Gadget
- Page last reviewed: June 27, 2017
- Page last updated: June 27, 2017
- Content source: