

Appalachian Diabetes Control and Translation Project
 ShareCompartir
The Appalachian Region
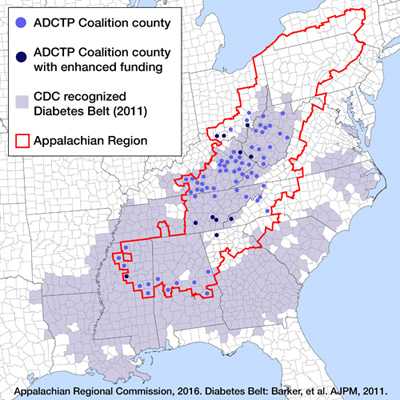
 The Appalachian Region is a 205,000-square-mile area that follows the spine of the Appalachian Mountains from southern New York to northern Mississippi. The region includes 420 counties in 13 states. It extends more than 1,000 miles and is home to more than 25 million people.
Many people in Appalachia face serious and unique health challenges, which are influenced by factors including socioeconomic status, living in rural areas, and culture. Compared with the rest of the nation, the people of Appalachia experience notably lower health care access, higher rates of substance use and mental health disorders, and higher rates of cancer and chronic diseases including heart disease, stroke, and diabetes. These differences in health outcomes are especially pronounced in the region’s most economically distressed counties.1-3
Diabetes in the Appalachian Region
 In a 2010 study, researchers found that residents in the 78 counties classified as distressed (lowest on a five-point socioeconomic scale) by the Appalachian Regional Commission (ARC) were 1.4 times more likely to have diabetes than residents of non-Appalachian counties. Also, the prevalence of diabetes in people aged 45 to 64 years was approximately 1 in 5 in distressed counties, but only 1 in 8 in non-Appalachian counties.3
In 2011, the Centers for Disease Control and Prevention ( CDC ) labeled a 644-county area of the United States as the “diabetes belt,” at that time, approximately 11.7% of the population was diagnosed with diabetes as compared with only 8.5% of the population residing outside the belt. More than 33% of the diabetes belt [PDF - 205 KB] counties lie in central and southern Appalachia.4 Multi-sectoral engagement is needed to prevent and control diabetes and reduce the burden of this disease in this region.
Purpose of the Appalachian Diabetes Control and Translation Project (ADCTP)
The purpose of the Appalachian Diabetes Control and Translation Project is to reduce the effect of diabetes among people who live in high risk (distressed) communities in Appalachia. With support from CDC’s Division of Diabetes Translation (DDT) and the Appalachian Regional Commission, the Center for Rural Health at Marshall University in Huntington, West Virginia, is building an infrastructure of community-based diabetes coalitions that serves 73 counties in 9 states.
Using CDC’s Diabetes Today program as the community-based planning translation model, the Appalachian Diabetes Control and Translation Project
- Facilitates the formation of coalitions to plan, implement, and evaluate local prevention and control activities.
- Builds the competency of community leaders and health care professionals to implement, support, and evaluate evidence-based programs such as the National Diabetes Prevention Program ( National DPP ), the Diabetes Self-Management Education Program (DSME), and the Stanford Chronic Disease Self-Management Program (CDSMP).
- Encourages collaborations with state and local health departments, Federally Qualified Health Centers, and other strategic partners to control and prevent type 2 diabetes.
In 2011, the Center for Rural Health at Marshall University secured a $2.6 million award from the Bristol-Myers Squibb Foundation to expand the reach and impact of ADCTP. This major source of funding was competed among existing coalitions, and enhanced funding was provided for the strongest coalitions. Interventions were focused on building access to quality preventive services, healthy foods, physical activity, and healthy environments in 10 counties.
Accomplishments
Since 2011, the Appalachian Diabetes Control and Translation Project coalitions have reported numerous accomplishments:
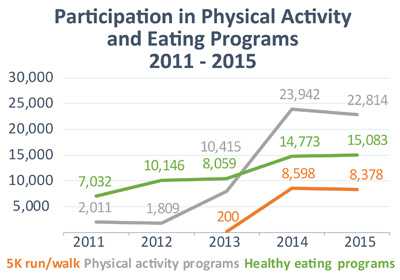
- Expanded Public Engagement and Behavioral Change: Coalitions focused on key diabetes risk factors, such as physical activity and diet, and have greatly expanded community participation in local events. Participants in physical activity programs have increased more than 11-fold from 2,011 to 2015. Participants in healthy eating programs more than doubled from 7,032 in 2011 to 15,083 in 2015.
- Scaling and Sustaining the National Diabetes Prevention Program (National DPP): In 2014, Appalachian Diabetes Control and Translation Project began efforts to support implementation of the National DPP in coalition communities to prevent or delay the onset of type 2 diabetes. The program awarded $2,000 in mini-grants to promote the program and to recruit eligible participants. As of December 2015, coalitions have helped 132 participants enroll in CDC-recognized diabetes prevention programs.
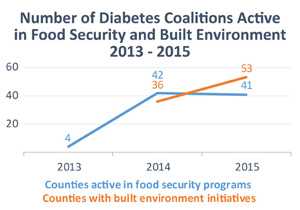
- Increased Focus on Local Policy Issues: ADCTP coalitions are finding opportunities to address local policies that affect type 2 diabetes management and prevention. For example, nearly all coalitions (96%) worked to improve public facilities and other built environments so it will be easier for people to be more physically active. Seventy-five percent of coalitions were also involved in initiatives that bring healthier food choices to those facing hunger.
- Coalition Strength: Of 76 coalitions formed between 2000 and 2015, 59 (77%) were still active in 2016, suggesting the success of the community engagement process in these communities.
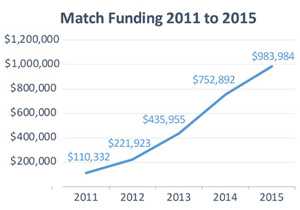
- Leveraging Resources: Coalitions demonstrated success in leveraging local resources. Matching funds increased each year from just over $110,000 in 2011 to nearly $1 million 2015. These funds represent the sum of volunteer labor at $17 an hour, cash donations, and grants from local sources.
Success in Action!
Meigs County (Tennessee) Celebrates Grand Opening of New Walking Track
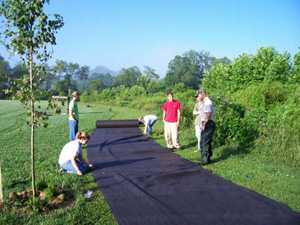 A local community assessment found that 34.6% of adults were physically inactive, and 34.2% were obese. The Meigs County Health Council then identified type 2 diabetes prevention as a need in the community and applied for an ADCTP grant. Upon receiving the award, a portion of the funding was used to construct a walking track to provide a safe walking area for the Meigs South Elementary School students and other residents in Southern Meigs County.
Meigs South Elementary School celebrated the grand opening of their new walking track in September 2012. Construction was accomplished through collaboration with a local contractor, coalition members, a community partner, and the Meigs County Highway Department.5
Mingo County (West Virginia) Trailblazers
A certified diabetes educator and an extension service agent in Mingo County, West Virginia, met for coffee to discuss their concern about the high prevalence of diabetes in the county (13%). In addition, they noted many residents struggled to control their disease because of limited resources or community support to help them adopt healthier lifestyles. Working together, the diabetes educator and the extension agent applied for a planning grant from the Appalachian Diabetes Control and Translation Project to establish a diabetes coalition in Mingo County.
The Mingo County Diabetes Coalition brought together clinical partners that included a local physician, four mid-level practitioners, and two certified diabetes educators from an American Diabetes Association (ADA)-recognized DSME program. The group organized coalition members to develop cooking classes, a community garden, and team-based walking competitions. Walking competitions have now been adopted by over 50 of the coalitions in the Appalachian Diabetes Control and Translation network. The Mingo County Diabetes Coalition also was the first coalition to sponsor monthly 5K runs/walks.
The funding from the Center for Medicaid and Medicare Services and technical assistance provided by the Appalachian Diabetes Control and Translation Project, helped to hire and train a group of Community Health Workers (CHWs). Under the supervision of the clinic staff, CHWs worked with high risk patients and made weekly home visits to help patients practice self-management skills such as taking prescribed medications, checking blood sugar levels, making healthy food choices, and following up on clinic visits. When CHWs started following up on more than 100 patients, the average baseline A1C was 10%. Six months later, the average A1C was 7.5%, reflecting a decrease of 2.5 percentage points. The CHWs continue to encourage patient involvement in the various community-based activities and share the availability of non-clinical resources for their patients.6
The CHWs and the health care team helped improve patients’ self-management behaviors and home environments and provided patients with resources to help foster healthier eating habits and increased physical activity.
Looking Ahead
Partners
The Appalachian Regional Commission is an economic development agency of the federal government and 13 state governments focusing on 420 counties across the Appalachian Region. The Appalachian Regional Commission’s mission is to innovate, partner, and build community capacity and strengthen economic growth in Appalachia to help the region achieve socioeconomic parity with the nation.
The Center for Rural Health at Marshall University supports the development and dissemination of evidence-based and best practice programs. For the Appalachian Diabetes Control and Translation Project, a team of four professionals work with communities in distressed counties to develop and support diabetes coalitions. They provide ongoing technical assistance and leadership training and conduct site visits. They also link the coalitions with resources that strengthen the coalitions’ work.
In 2016 and beyond, the Appalachian Diabetes Control and Translation Project will continue to strengthen its coalition network by engaging new coalitions in distressed and underserved areas, and by providing expert technical assistance for existing coalitions. Coalitions will be increasingly involved in expanding the National DPP and other evidence-based programs that have not been deployed extensively in rural, low-resource settings. In addition, the partnership will begin developing an improved approach to evaluate and monitor the impact of coalition activity.
- Wood L. Trends in National and Regional Economic Distress, 1960-2000. Washington, DC: Appalachian Regional Commission.
- Halverson JA, Bichak G. Underlying Socioeconomic Factors Influencing Health Disparities in the Appalachian Region. Washington, DC: Appalachian Regional Commission; March 2008.
- Barker L, Crespo R, Gerzoff RB, Denham S, Shrewsberry M, Cornelius-Averhart D. Residence in a distressed county in Appalachia as a risk factor for diabetes, Behavioral Risk Factor Surveillance System, 2006-2007. Prev Chronic Dis 2010;7(5):A104.
- Barker LE. Kirtland KA, Gregg E, Geiss l, Thompson T. Geographic distribution of diagnosed diabetes in the United. States: a diabetes belt. Am J Prev Med. 2011;40(4):434–439.
- Wilson J. Meigs South celebrates grand opening of elementary walking track. Chattanoogan.com. September 24, 2012.
- Crespo R, Hatfield V, Hudson J, Justice M. Partnership with community health workers extends the reach of diabetes educators. AADE in Practice. 2015;3:24–29.
- Page last reviewed: January 9, 2017
- Page last updated: January 9, 2017
- Content source:
- Maintained By:
- National Center for Chronic Disease Prevention and Health Promotion, Division of Diabetes Translation