

County Data
 ShareCompartir
The County Data application allows you to view data and trends of diagnosed diabetes, obesity, and leisure-time physical inactivity at the national, state, and county levels. You will be able to access 1) state and county-level data in the United States, 2) data on how counties compare with each other, and 3) maps and motion charts to examine how changes in diabetes coincide with changes in obesity over time and by location. These data can help the public to better use existing resources for diabetes management and prevention efforts.
County Data
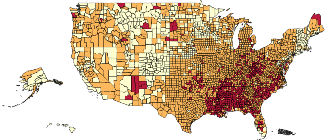
Atlas (maps) of county-level data and trends.
County Rankings
Atlas (maps) of county-level rankings and trends.
All States Motion Charts
Atlas (maps and motion “bubble” charts ) of state and county-level data and trends.
Additional Information
- Page last reviewed: May 2, 2017
- Page last updated: May 2, 2017
- Content source:
- Maintained By:
- National Center for Chronic Disease Prevention and Health Promotion, Division of Diabetes Translation