Wiggers diagram
A Wiggers diagram, named after its developer, Carl Wiggers, is a standard diagram that is used in teaching cardiac physiology.[1] In the Wiggers diagram, the X-axis is used to plot time, while the Y-axis contains all of the following on a single grid:
- Blood pressure
- Aortic pressure
- Ventricular pressure
- Atrial pressure
- Ventricular volume
- Electrocardiogram
- Arterial flow (optional)
- Heart sounds (optional)
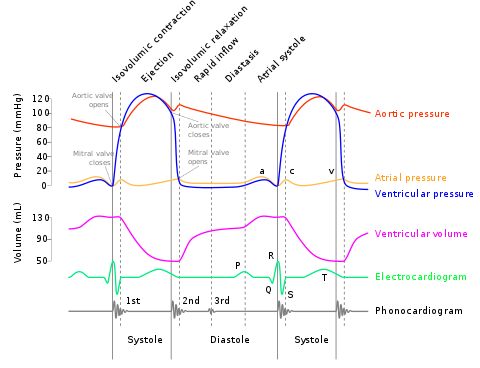
A Wiggers diagram
The Wiggers diagram clearly illustrates the coordinated variation of these values as the heart beats, assisting one in understanding the entire cardiac cycle.
Events
| Phase | EKG | Heart sounds | Semilunar valves | Atrioventricular valves | |
| A | Atrial systole | P | S4* | closed | open |
| B | Ventricular systole - Isovolumetric/isovolumic contraction | QRS | S1 ("lub") | closed | closed |
| C1 | Ventricular systole - Ejection 1 | - | open | closed | |
| C2 | Ventricular systole - Ejection 2 | T | open | closed | |
| D | Ventricular diastole - Isovolumetric/isovolumic relaxation | - | S2 ("dub") | closed | closed |
| E1 | Ventricular diastole - Ventricular filling 1 | - | S3* | closed | open |
| E2 | Ventricular diastole - Ventricular filling 2 | - | closed | open |
Note that during isovolumetric/isovolumic contraction and relaxation, all the heart valves are closed. At no time are all the heart valves open.
- S3 and S4 heart sounds are associated with pathologies and are not routinely heard.
See also
References
- Mitchell, Jamie R.; Wang, Jiun-Jr (2014-06-01). "Expanding application of the Wiggers diagram to teach cardiovascular physiology". Advances in Physiology Education. 38 (2): 170–175. doi:10.1152/advan.00123.2013. ISSN 1043-4046. PMC 4056172. PMID 24913453.
Additional images
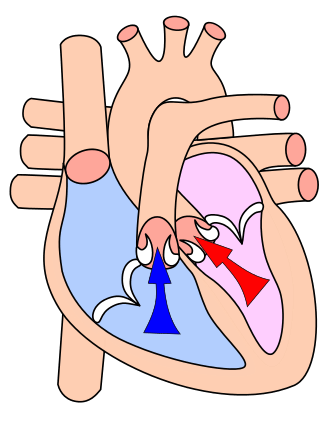 Ventricular systole
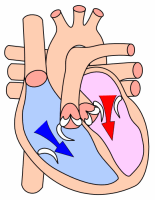 Cardiac diastole
 ECG
ECG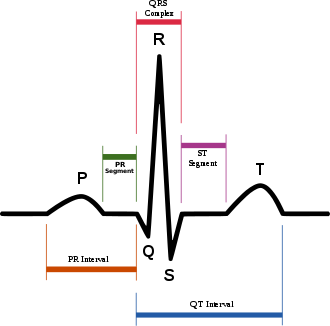 The EKG complex. P=P wave, PR=PR interval, QRS=QRS complex, QT=QT interval, ST=ST segment, T=T wave
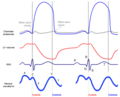 Wiggers with jugular venous waveform
This article is issued from
Wikipedia.
The text is licensed under Creative
Commons - Attribution - Sharealike.
Additional terms may apply for the media files.