QRS complex
The QRS complex is the combination of three of the graphical deflections seen on a typical electrocardiogram (EKG or ECG). It is usually the central and most visually obvious part of the tracing; in other words, it's the main spike seen on an ECG line. It corresponds to the depolarization of the right and left ventricles of the human heart and contraction of the large ventricular muscles.
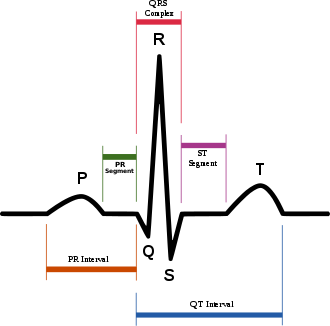
In adults, the QRS complex normally lasts 0.06–0.10 s; in children and during physical activity, it may be shorter. The Q, R, and S waves occur in rapid succession, do not all appear in all leads, and reflect a single event and thus are usually considered together. A Q wave is any downward deflection immediately following the P wave. An R wave follows as an upward deflection, and the S wave is any downward deflection after the R wave. The T wave follows the S wave, and in some cases, an additional U wave follows the T wave.
Formation
Depolarization of the heart ventricles occurs almost simultaneously, via the bundle of His and Purkinje fibers. If they are working efficiently, the QRS complex is 80 to 120 ms in duration. This is represented by three small squares or less at the standard paper speed of 25 mm/s.
Clinical significance
Any abnormality of conduction takes longer and causes "widened" QRS complexes. In bundle branch block, there can be an abnormal second upward deflection within the QRS complex. In this case, such a second upward deflection is referred to as R' (pronounced "R prime"). This would be described as an RSR' pattern.
Ventricles contain more muscle mass than the atria. Therefore, the QRS complex is considerably larger than the P wave. The QRS complex is often used to determine the axis of the electrocardiogram, although it is also possible to determine a separate P wave axis.
The duration, amplitude, and morphology of the QRS complex are useful in diagnosing cardiac arrhythmias, conduction abnormalities, ventricular hypertrophy, myocardial infarction, electrolyte derangements, and other disease states.
High frequency analysis of the QRS complex may be useful for detection of coronary artery disease during an exercise stress test.[1]
Components
| Parameter | Normal value | Value comments | Clinical significance |
|---|---|---|---|
| QRS duration | 0.06–0.10 s[2] | Shorter in children and in tachycardia[3] | Prolonged duration indicates e.g. hyperkalemia.[4] or bundle branch block |
| QRS amplitude |
|
Increased amplitude indicates cardiac hypertrophy | |
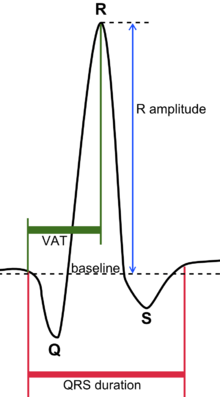
| Ventricular activation time (VAT) |
Measured in increased QRS amplitude[3] | ||
| Q wave | Abnormality indicates presence of infarction[5] |
The QRS complex is also included in estimating the QT interval.
Q wave
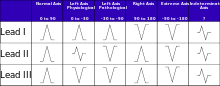
Normal Q waves, when present, represent depolarization of the interventricular septum. For this reason, they are referred to as septal Q waves and can be appreciated in the lateral leads I, aVL, V5 and V6.
Pathologic Q waves occur when the electrical signal passes through stunned or scarred heart muscle; as such, they are usually markers of previous myocardial infarctions, with subsequent fibrosis. A pathologic Q wave is defined as having a deflection amplitude of 25% or more of the subsequent R wave, or being > 0.04 s (40 ms) in width and > 2 mm in amplitude. However, diagnosis requires the presence of this pattern in more than one corresponding lead.
R wave progression
Looking at the precordial leads, the R wave usually progresses from showing an rS-type complex in V1 with an increasing R and a decreasing S wave when moving toward the left side. There is usually a qR-type of complex in V5 and V6, with the R-wave amplitude usually taller in V5 than in V6. It is normal to have a narrow QS and rSr' patterns in V1, and this is also the case for qRs and R patterns in V5 and V6. The transition zone is where the QRS complex changes from predominately negative to predominately positive (R/S ratio becoming >1), and this usually occurs at V3 or V4. It is normal to have the transition zone at V2 (called "early transition") and at V5 (called "delayed transition").[6] In biomedical engineering, the maximum amplitude in the R wave is usually called "R peak amplitude," or just "R peak."[7][8] Accurate R peak detection is essential in signal processing equipment for heart rate measurement and it is the main feature used for arrhythmia detection.[9][10]
The definition of poor R wave progression (PRWP) varies in the literature, but a common one is when the R wave is less than 2–4 mm in leads V3 or V4 and/or there is presence of a reversed R wave progression, which is defined as R in V4 < R in V3 or R in V3 < R in V2 or R in V2 < R in V1, or any combination of these.[6] Poor R wave progression is commonly attributed to anterior myocardial infarction, but it may also be caused by left bundle branch block, Wolff–Parkinson–White syndrome, right and left ventricular hypertrophy, or a faulty ECG recording technique.[6]
J-point
The point where the QRS complex meets the ST segment is the J-point. The J-point is easy to identify when the ST segment is horizontal and forms a sharp angle with the last part of the QRS complex. However, when the ST segment is sloped or the QRS complex is wide, the two features do not form a sharp angle and the location of the J-point is less clear. There is no consensus on the precise location of the J-point in these circumstances.[11] Two possible definitions are:
Terminology
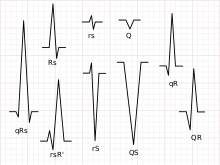
Not every QRS complex contains a Q wave, an R wave, and an S wave. By convention, any combination of these waves can be referred to as a QRS complex. However, correct interpretation of difficult ECGs requires exact labeling of the various waves. Some authors use lowercase and capital letters, depending on the relative size of each wave. For example, an Rs complex would be positively deflected, while an rS complex would be negatively deflected. If both complexes were labeled RS, it would be impossible to appreciate this distinction without viewing the actual ECG.
Monomorphic or polymorphic
Monomorphic refers to all QRS waves in a single lead being similar in shape. Polymorphic means that the QRS change from complex to complex.[13] These terms are used in the description of ventricular tachycardia.
Algorithms
A common algorithm used for QRS complex detection is the Pan-Tompkins[14] algorithm (or method); another is based on the Hilbert transform.[15][16][17][18] Numerous other algorithms have been proposed and investigated.[19]
See also
References
- Gerald, F; Philip, A; Kligfield, P; et al. (August 2013). "Exercise Standards for Testing and Training A Scientific Statement From the American Heart Association". American Heart Association (128): 873–934.
- III. Characteristics of the Normal ECG Frank G. Yanowitz, MD. Professor of Medicine. University of Utah School of Medicine. Retrieved on April 14, 2010
- Compendium for interpretation of ECG at Uppsala Institution for Clinical Physiology. Year 2010
- Complementary and Alternative Medicine Index (CAM) Archived September 4, 2009, at the Wayback Machine
- Loyola University Chicago Stritch School of Medicine. > EKG Interpretive skills Retrieved on April 22, 2010
- Poor R-Wave Progression. By: Ross MacKenzie, MD. J Insur Med 2005;37:58–62
- Piotr S. Szczepaniak; Paulo J. G. Lisboa; Janusz Kacprzyk (2000). Fuzzy Systems in Medicine. Springer. p. 256. ISBN 978-3-7908-1263-3.
- Adam Gacek; Witold Pedrycz (2011). ECG Signal Processing, Classification and Interpretation: A Comprehensive Framework of Computational Intelligence. Springer. p. 108. ISBN 978-0-85729-867-6.
- S J Pise (2011). ThinkQuest 2010: Proceedings of the First International Conference on Contours of Computing Technology. Springer. p. 8. ISBN 978-81-8489-988-7.
- Hoi-Jun Yoo; Chris van Hoof (2010). Bio-Medical CMOS ICs. Springer. p. 197. ISBN 978-1-4419-6596-7.
- Brownfield, J; Herbert, M (January 2008). "EKG Criteria for Fibrinolysis: What's Up with the J Point?". The western journal of emergency medicine. 9 (1): 40–42. PMC 2672223. PMID 19561701.
- PSTF Paramedic Student Electrocardiography
- Kenneth M Sutin; Marino, Paul L. (2007). The ICU book. Hagerstwon, MD: Lippincott Williams & Wilkins. p. 356. ISBN 0-7817-4802-X.
- Pan, J.; Tompkins, W. J. (1985). "A Real-Time QRS Detection Algorithm". IEEE Transactions on Biomedical Engineering (3): 230. doi:10.1109/TBME.1985.325532.
- Tarek Sobh; Khaled Elleithy (2010). Innovations in Computing Sciences and Software Engineering. Springer. p. 462. ISBN 978-90-481-9111-6.
- Chwee Teck Lim; James Goh Cho Hong (2009). 13th International Conference on Biomedical Engineering: ICBME 2008, 3–6 December 2008, Singapore. Springer. p. 469. ISBN 978-3-540-92840-9.
- Subhasis Chaudhuri; Tanmay D. Pawar; Siddhartha Duttagupta (2009). Ambulation Analysis in Wearable ECG. Springer. p. 67. ISBN 978-1-4419-0725-7.
- Lodewijk Bos (2010). Medical and Care Compunetics 6. IOS Press. p. 41. ISBN 978-1-60750-564-8.
- Kohler, B. -U.; Hennig, C.; Orglmeister, R. (2002). "The principles of software QRS detection". IEEE Engineering in Medicine and Biology Magazine. 21 (1): 42–57. doi:10.1109/51.993193. PMID 11935987.