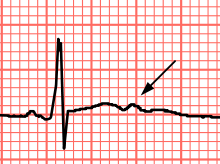
U wave
The 'U' wave is a wave on an electrocardiogram (ECG). It comes after the T wave of ventricular repolarization and may not always be observed as a result of its small size. 'U' waves are thought to represent repolarization of the Purkinje fibers.[1][2] However, the exact source of the U wave remains unclear. The most common theories for the origin are:
- Delayed repolarization of Purkinje fibers
- Prolonged re-polarisation of mid-myocardial M-cells
- After-potentials resulting from mechanical forces in the ventricular wall
- The repolarization of the papillary muscle.[3]
Description
According to V. Gorshkov-Cantacuzene:
"The U wave is the momentum carried by the blood in the coronary arteries and blood vessels".[4][5][6]
The resistivity of stationary blood is expressed as , where is a coefficient, and is the hematocrit; at that time, as during acceleration of the blood flow occurs a sharp decrease in the longitudinal resistance with small relaxation times.


However, multiple factors affect blood resistivity. Erythrocyte aggregation occurs at low shear rates and implies that to all vessels (with the exception of large veins) the effect of aggregation is irrelevant. The interior of a blood vessel includes a near-wall layer of plasma (referred to as lubricant), the size of which strictly depends on Reynold's criterion and the shear rate of the flowing blood. Given that the thickness of this layer in all blood vessels (except capillaries) is less than 5 microns, and the resistivity of the plasma is two times less than in blood, then according to the scheme of parallel insertion, the contribution of this layer to the resistivity is negligible. By reducing the speed of blood flow profiles the dependence of Ht on the radius of the vessel becomes more elongated. However, at normal values of Ht, the effect is also insignificant. With high enough shear rates, the red blood cells become susceptible to deformation. The contribution of this phenomenon is difficult to assess because it is present in the background of all the above effects. However, even the sum of all these factors has little effect on blood resistivity.
It follows that at the time of ejection of blood from the left ventricle, part of the pulse is carried away, because there is no electrical resistivity of blood, which gradually increases high up in the coronary arteries and blood vessels. The U wave is the momentum carried by the blood in the coronary arteries and blood vessels. It is possible to take this momentum back to Purkinje fibers along the vessels of the myocardium. This idea is also proved by the fact that hypertrophy of the left ventricle, myocardial ischemia, coronary and insufficiency have momentum there is no possibility to move to the Purkinje fibers, therefore, the ECG recorded a negative U wave.
Interpretation
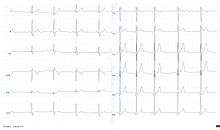
According to many studies, U waves often register in all leads except V6, most frequently in V2 and V3 when the heart rate is greater than 96 beats per minute. Its amplitude is often 0.1–0.33 mV. Particularly difficult is the allocation of the boundaries of the U wave on the background of the T wave and R wave, which may partial or complete (in the case of T wave) the merger. Higher values of heart rate or hypocalcemia U wave are superimposed on the T wave and in tachycardia — merges with the R-wave of the next cardiac cycle.
Prominent U waves are most often seen in hypokalemia but may be present in hypercalcemia, thyrotoxicosis, or exposure to digitalis, epinephrine and Class 1A and 3 antiarrhythmics, as well as in congenital long QT syndrome, and in the setting of intracranial hemorrhage.
An inverted U wave may represent myocardial ischemia (and especially appears to have a high positive predictive accuracy for left anterior descending coronary artery disease[7] ) or left ventricular volume overload.[8]
A U-wave can sometimes be seen in normal younger, athletic individuals.[9] The U-wave increases in adults that are older and less athletic.[10]
References
- Pérez Riera AR, Ferreira C, Filho CF, et al. (2008). "The enigmatic sixth wave of the electrocardiogram: the U wave". Cardiol J. 15 (5): 408–21. PMID 18810715.
- "ECG Learning Center - An introduction to clinical electrocardiography". ecg.utah.edu. Retrieved 2017-01-02.
- F., Boron, Walter; L., Boulpaep, Emile. Medical physiology : a cellular and molecular approach. ISBN 9781437717532. OCLC 756281854.
- V, Gorshkov-Cantacuzene (2016). "TO THE QUESTION OF THE ETHIOLOGY AND CLINICAL SIGNIFICANCE OF THE U WAWE OF THE ECG". Bulletin of Science and Practice. 10 (11): 130–133. doi:10.5281/zenodo.161068. ISSN 2414-2948.
- V A, Gorshkov-Cantacuzene (2015). "The clinical significance of the ECG U wave". Abstracts of XV Congress of "Heart Failure - 2015": 80.
- V A, Gorshkov-Cantacuzene. "Etiology and clinical significance of the ECG U wave". Proceedings of the Russian National Congress of Cardiologists. Cardiology 2016: Challenges and Solutions, Section: Fundamental Research: 520–521.
- Gerson MC, Phillips JF, Morris SN, McHenry PL (1979). "Exercise-induced U-wave inversion as a marker of stenosis of the left anterior descending coronary artery". Circulation. 60: 1014–1020. doi:10.1161/01.CIR.60.5.1014. PMID 487534.
- Conrath C, Opthof T (2005). "The patient U wave". Cardiovasc Res. 67 (2): 184–6. doi:10.1016/j.cardiores.2005.05.027. PMID 15979057.
- EKG-boken Eva Lind, Lars Lind, Liber, 2011
- Franckowiak, Shawn C.; Dobrosielski, Devon A.; Reilley, Suzanne M.; Walston, Jeremy D.; Andersen, Ross E. (May 2011). "Maximal Heart Rate Prediction in Adults that are Overweight or Obese". Journal of Strength and Conditioning Research. 25 (5): 1407–1412. doi:10.1519/JSC.0b013e3181d682d2. ISSN 1064-8011. PMC 3081386. PMID 21116203.