Cardiac output
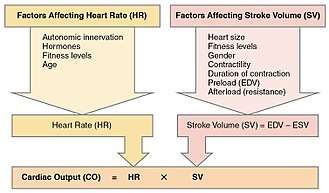
Cardiac output, also denoted by the symbols , or , is a term used in cardiac physiology that describes the volume of blood being pumped by the heart, in particular by the left or right ventricle, per unit time. Cardiac output is the product of the heart rate (HR), or the number of heart beats per minute (bpm), and the stroke volume (SV), which is the volume of blood pumped from the ventricle per beat; thus, CO = HR × SV. Values for cardiac output are usually denoted as L/min. For a healthy person weighing 70 kg, the cardiac output at rest averages about 5 L/min; assuming a heart rate of 70 beats/min, the stroke volume would be approximately 70 mL.


Because cardiac output is related to the quantity of blood delivered to various parts of the body, it is an important indicator of how efficiently the heart can meet the body's demands for perfusion. For instance, physical exercise requires a higher than resting-level of oxygen to support increased muscle activity, where, in the case of heart failure, actual CO may be insufficient to support even simple activities of daily living; nor can it increase sufficiently to meet the higher metabolic demands stemming from even moderate exercise.
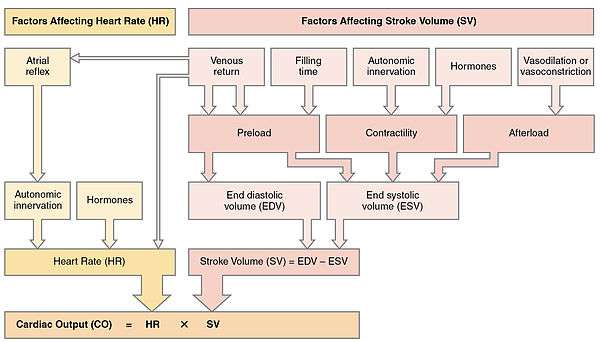
Cardiac output is a global blood flow parameter of interest in hæmodynamics, the study of the flow of blood. The factors affecting stroke volume and heart rate also affect cardiac output. The figure at the right margin illustrates this dependency and lists some of these factors. A detailed hierarchical illustration is provided in a subsequent figure.
There are many methods of measuring CO, both invasively and non-invasively; each has advantages and drawbacks as described below.
Definition
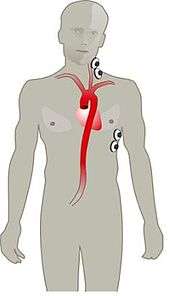
The function of the heart is to drive blood through the circulatory system in a cycle that delivers oxygen, nutrients and chemicals to the body's cells and removes cellular waste. Because it pumps out whatever blood comes back into it from the venous system, the quantity of blood returning to the heart effectively determines the quantity of blood the heart pumps out – its cardiac output, Q. Cardiac output is classically defined alongside stroke volume (SV) and the heart rate (HR) as:
-
(1)

In standardizing what CO values are considered to be within normal range independent of the size of the subject's body, the accepted convention is to further index equation (1) using Body surface area (BSA), giving rise to the Cardiac index (CI). This is detailed in equation (2) below.
Measurement
There are a number of clinical methods to measure cardiac output, ranging from direct intracardiac catheterization to non-invasive measurement of the arterial pulse. Each method has advantages and drawbacks. Relative comparison is limited by the absence of a widely accepted "gold standard" measurement. Cardiac output can also be affected significantly by the phase of respiration – intra-thoracic pressure changes influence diastolic filling and therefore cardiac output. This is especially important during mechanical ventilation, in which cardiac output can vary by up to 50% across a single respiratory cycle. Cardiac output should therefore be measured at evenly spaced points over a single cycle or averaged over several cycles.
Invasive methods are well accepted, but there is increasing evidence that these methods are neither accurate nor effective in guiding therapy. Consequently, the focus on development of non-invasive methods is growing.[2][3][4]
Doppler ultrasound
This method uses ultrasound and the Doppler effect to measure cardiac output. The blood velocity through the heart causes a Doppler shift in the frequency of the returning ultrasound waves. This shift can then be used to calculate flow velocity and volume, and effectively cardiac output, using the following equations:


where:
- CSA is the valve orifice cross sectional area,
- r is the valve radius, and,
- VTI is the velocity time integral of the trace of the Doppler flow profile.
Being non-invasive, accurate and inexpensive, Doppler ultrasound is a routine part of clinical ultrasound; it has high levels of reliability and reproducibility, and has been in clinical use since the 1960s.
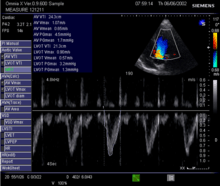
Echocardiography
Echocardiography is a non-invasive method of quantifying cardiac output using ultrasound. Two-dimensional (2D) ultrasound and Doppler measurements are used together to calculate cardiac output. 2D measurement of the diameter (d) of the aortic annulus allows calculation of the flow cross-sectional area (CSA), which is then multiplied by the VTI of the Doppler flow profile across the aortic valve to determine the flow volume per beat (stroke volume, SV). The result is then multiplied by the heart rate (HR) to obtain cardiac output. Although used in clinical medicine, it has a wide test-retest variability.[5] It is said to require extensive training and skill, but the exact steps needed to achieve clinically adequate precision have never been disclosed. 2D measurement of the aortic valve diameter is one source of noise; others are beat-to-beat variation in stroke volume and subtle differences in probe position. An alternative that is not necessarily more reproducible is the measurement of the pulmonary valve to calculate right-sided CO. Although it is in wide general use, the technique is time consuming and is limited by the reproducibility of its component elements. In the manner used in clinical practice, precision of SV and CO is of the order of ±20%.
Transcutaneous
The Ultrasonic Cardiac Output Monitor (USCOM) uses continuous wave Doppler to measure the Doppler flow profile VTI. It uses anthropometry to calculate aortic and pulmonary valve diameters and CSAs, allowing right-sided and left-sided Q measurements. In comparison to the echocardiographic method, USCOM significantly improves reproducibility and increases sensitivity of the detection of changes in flow. Real-time, automatic tracing of the Doppler flow profile allows beat-to-beat right-sided and left-sided Q measurements, simplifying operation and reducing the time of acquisition compared to conventional echocardiography. USCOM has been validated from 0.12 l/min to 18.7 l/min[6] in new-born babies,[7] children[8] and adults.[9] The method can be applied with equal accuracy to patients of all ages for the development of physiologically rational haemodynamic protocols. USCOM is the only method of cardiac output measurement to have achieved equivalent accuracy to the implantable flow probe.[10] This accuracy has ensured high levels of clinical use in conditions including sepsis, heart failure and hypertension.[11][12][13]
Transoesophageal
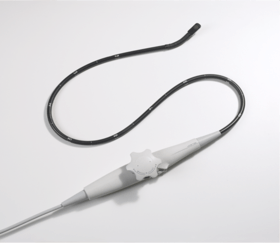
Transoesophageal Doppler includes two main technologies; transoesophageal echocardiogram—which is primarily used for diagnostic purposes, and oesophageal Doppler monitoring—which is primarily used for the clinical monitoring of cardiac output. The latter uses continuous wave Doppler to measure blood velocity in the descending thoracic aorta. An ultrasound probe is inserted either orally or nasally into the oesophagus to mid-thoracic level, at which point the oesophagus lies alongside the descending thoracic aorta. Because the transducer is close to the blood flow, the signal is clear. The probe may require re-focussing to ensure an optimal signal. This method has good validation, is widely used for fluid management during surgery with evidence for improved patient outcome,[14][15][16][17][18][19][20][21] and has been recommended by the UK's National Institute for Health and Clinical Excellence (NICE).[22] Oesophageal Doppler monitoring measures the velocity of blood and not true Q, therefore relies on a nomogram[23] based on patient age, height and weight to convert the measured velocity into stroke volume and cardiac output. This method generally requires patient sedation and is accepted for use in both adults and children.
Pulse pressure methods
Pulse pressure (PP) methods measure the pressure in an artery over time to derive a waveform and use this information to calculate cardiac performance. However, any measure from the artery includes changes in pressure associated with changes in arterial function, for example compliance and impedance. Physiological or therapeutic changes in vessel diameter are assumed to reflect changes in Q. PP methods measure the combined performance of the heart and the blood vessels, thus limiting their application for measurement of Q. This can be partially compensated for by intermittent calibration of the waveform to another Q measurement method then monitoring the PP waveform. Ideally, the PP waveform should be calibrated on a beat-to-beat basis. There are invasive and non-invasive methods of measuring PP.
Finapres methodology
In 1967, the Czech physiologist Jan Peňáz invented and patented the volume clamp method of measuring continuous blood pressure. The principle of the volume clamp method is to dynamically provide equal pressures, on either side of an artery wall. By clamping the artery to a certain volume, inside pressure—intra-arterial pressure—balances outside pressure—finger cuff pressure. Peñáz decided the finger was the optimal site to apply this volume clamp method. The use of finger cuffs excludes the device from application in patients without vasoconstriction, such as in sepsis or in patients on vasopressors.
In 1978, scientists at BMI-TNO, the research unit of Netherlands Organisation for Applied Scientific Research at the University of Amsterdam, invented and patented a series of additional key elements that make the volume clamp work in clinical practice. These methods include the use of modulated infrared light in the optical system inside the sensor, the lightweight, easy-to-wrap finger cuff with velcro fixation, a new pneumatic proportional control valve principle, and a set point strategy for the determining and tracking the correct volume at which to clamp the finger arteries—the Physiocal system. An acronym for physiological calibration of the finger arteries, this Physiocal tracker was found to be accurate, robust and reliable.
The Finapres methodology was developed to use this information to calculate arterial pressure from finger cuff pressure data. A generalised algorithm to correct for the pressure level difference between the finger and brachial sites in patients was developed. This correction worked under all of the circumstances it was tested in—even when it was not designed for it—because it applied general physiological principles. This innovative brachial pressure waveform reconstruction method was first implemented in the Finometer, the successor of Finapres that BMI-TNO introduced to the market in 2000.
The availability of a continuous, high-fidelity, calibrated blood pressure waveform opened up the perspective of beat-to-beat computation of integrated haemodynamics, based on two notions: pressure and flow are inter-related at each site in the arterial system by their so-called characteristic impedance. At the proximal aortic site, the 3-element Windkessel model of this impedance can be modelled with sufficient accuracy in an individual patient with known age, gender, height and weight. According to comparisons of non-invasive peripheral vascular monitors, modest clinical utility is restricted to patients with normal and invariant circulation.[24]
Invasive
Invasive PP monitoring involves inserting a manometer pressure sensor into an artery—usually the radial or femoral artery—and continuously measuring the PP waveform. This is generally done by connecting the catheter to a signal processing device with a display. The PP waveform can then be analysed to provide measurements of cardiovascular performance. Changes in vascular function, the position of the catheter tip or damping of the pressure waveform signal will affect the accuracy of the readings. Invasive PP measurements can be calibrated or uncalibrated.
Calibrated PP – PiCCO, LiDCO

PiCCO (PULSION Medical Systems AG, Munich, Germany) and PulseCO (LiDCO Ltd, London, England) generate continuous Q by analysing the arterial PP waveform. In both cases, an independent technique is required to provide calibration of continuous Q analysis because arterial PP analysis cannot account for unmeasured variables such as the changing compliance of the vascular bed. Recalibration is recommended after changes in patient position, therapy or condition.
In PiCCO, transpulmonary thermodilution, which uses the Stewart-Hamilton principle but measures temperatures changes from central venous line to a central arterial line, i.e., the femoral or axillary arterial line, is used as the calibrating technique. The Q value derived from cold-saline thermodilution is used to calibrate the arterial PP contour, which can then provide continuous Q monitoring. The PiCCO algorithm is dependent on blood pressure waveform morphology (mathematical analysis of the PP waveform), and it calculates continuous Q as described by Wesseling and colleagues.[25] Transpulmonary thermodilution spans right heart, pulmonary circulation and left heart, allowing further mathematical analysis of the thermodilution curve and giving measurements of cardiac filling volumes (GEDV), intrathoracic blood volume and extravascular lung water. Transpulmonary thermodilution allows for less invasive Q calibration but is less accurate than PA thermodilution and requires a central venous and arterial line with the accompanied infection risks.
In LiDCO, the independent calibration technique is lithium chloride dilution using the Stewart-Hamilton principle. Lithium chloride dilution uses a peripheral vein and a peripheral arterial line. Like PiCCO, frequent calibration is recommended when there is a change in Q.[26] Calibration events are limited in frequency because they involve the injection of lithium chloride and can be subject to errors in the presence of certain muscle relaxants. The PulseCO algorithm used by LiDCO is based on pulse power derivation and is not dependent on waveform morphology.
Statistical analysis of arterial pressure – FloTrac/Vigileo
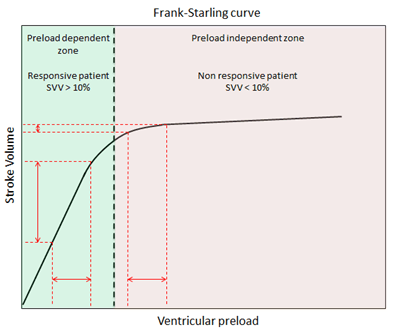
FloTrac/Vigileo (Edwards Lifesciences) is an uncalibrated, haemodynamic monitor based on pulse contour analysis. It estimates cardiac output (Q) using a standard arterial catheter with a manometer located in the femoral or radial artery. The device consists of a high-fidelity pressure transducer, which, when used with a supporting monitor (Vigileo or EV1000 monitor), derives left-sided cardiac output (Q) from a sample of arterial pulsations. The device uses an algorithm based on the Frank–Starling law of the heart, which states pulse pressure (PP) is proportional to stroke volume (SV). The algorithm calculates the product of the standard deviation of the arterial pressure (AP) wave over a sampled period of 20 seconds and a vascular tone factor (Khi, or χ) to generate stroke volume. The equation in simplified form is: , or, . Khi is designed to reflect arterial resistance; compliance is a multivariate polynomial equation that continuously quantifies arterial compliance and vascular resistance. Khi does this by analyzing the morphological changes of arterial pressure waveforms on a bit-by-bit basis, based on the principle that changes in compliance or resistance affect the shape of the arterial pressure waveform. By analyzing the shape of said waveforms, the effect of vascular tone is assessed, allowing the calculation of SV. Q is then derived using equation (1). Only perfused beats that generate an arterial waveform are counted for in HR.


This system estimates Q using an existing arterial catheter with variable accuracy. These arterial monitors do not require intracardiac catheterisation from a pulmonary artery catheter. They require an arterial line and are therefore invasive. As with other arterial waveform systems, the short set-up and data acquisition times are benefits of this technology. Disadvantages include its inability to provide data regarding right-sided heart pressures or mixed venous oxygen saturation.[27][28] The measurement of Stroke Volume Variation (SVV), which predicts volume responsiveness is intrinsic to all arterial waveform technologies. It is used for managing fluid optimisation in high-risk surgical or critically ill patients. A physiologic optimization program based on haemodynamic principles that incorporates the data pairs SV and SVV has been published.[29]
Arterial monitoring systems are unable to predict changes in vascular tone; they estimate changes in vascular compliance. The measurement of pressure in the artery to calculate the flow in the heart is physiologically irrational and of questionable accuracy,[30] and of unproven benefit.[31] Arterial pressure monitoring is limited in patients off-ventilation, in atrial fibrillation, in patients on vasopressors, and in those with a dynamic autonomic system such as those with sepsis.[26]
Uncalibrated, pre-estimated demographic data-free – PRAM
Pressure Recording Analytical Method (PRAM), estimates Q from the analysis of the pressure wave profile obtained from an arterial catheter—radial or femoral access. This PP waveform can then be used to determine Q. As the waveform is sampled at 1000 Hz, the detected pressure curve can be measured to calculate the actual beat-to-beat stroke volume. Unlike FloTrac, neither constant values of impedance from external calibration, nor form pre-estimated in vivo or in vitro data, are needed.
PRAM has been validated against the considered gold standard methods in stable condition[32] and in various haemodynamic states.[33] It can be used to monitor pediatric and mechanically supported patients.[34][35]
Generally monitored haemodynamic values, fluid responsiveness parameters and an exclusive reference are provided by PRAM: Cardiac Cycle Efficiency (CCE). It is expressed by a pure number ranging from 1 (best) to -1 (worst) and it indicates the overall heart-vascular response coupling. The ratio between heart performance and consumed energy, represented as CCE "stress index", can be of paramount importance in understanding the patient's present and future courses.[36]
Impedance cardiography
Impedance cardiography (often abbreviated as ICG, or Thoracic Electrical Bioimpedance (TEB)) measures changes in electrical impedance across the thoracic region over the cardiac cycle. Lower impedance indicates greater intrathoracic fluid volume and blood flow. By synchronizing fluid volume changes with the heartbeat, the change in impedance can be used to calculate stroke volume, cardiac output and systemic vascular resistance.[37]
Both invasive and non-invasive approaches are used.[38] The reliability and validity of the non-invasive approach has gained some acceptance,[39][40][41][42] although there is not complete agreement on this point.[43] The clinical use of this approach in the diagnosis, prognosis and therapy of a variety of diseases continues.[44]
Non-invasive ICG equipment includes the Bio-Z Dx,[45] the Niccomo,[46] and TEBCO products by BoMed.[47][48]
Ultrasound dilution
Ultrasound dilution (UD) uses body-temperature normal saline (NS) as an indicator introduced into an extracorporeal loop to create an atriovetricular (AV) circulation with an ultrasound sensor, which is used to measure the dilution then to calculate cardiac output using a proprietary algorithm. A number of other haemodynamic variables, such as total end-diastole volume (TEDV), central blood volume (CBV) and active circulation volume (ACVI) can be calculated using this method.
The UD method was firstly introduced in 1995.[49] It was extensively used to measure flow and volumes with extracorporeal circuit conditions, such as ECMO[50][51] and Haemodialysis,[52][53] leading more than 150 peer reviewed publications. UD has now been adapted to intensive care units (ICU) as the COstatus device.[54]
The UD method is based on ultrasound indicator dilution.[55] Blood ultrasound velocity (1560–1585 m/s) is a function of total blood protein concentration—sums of proteins in plasma and in red blood red cells—and temperature. Injection of body-temperature normal saline (ultrasound velocity of saline is 1533 m/s) into a unique AV loop decreases blood ultrasound velocity, and produces dilution curves.
UD requires the establishment of an extracorporeal circulation through its unique AV loop with two pre-existing arterial and central venous lines in ICU patients. When the saline indicator is injected into the AV loop, it is detected by the venous clamp-on sensor on the loop before it enters the patient’s heart's right atrium. After the indicator traverses the heart and lung, the concentration curve in the arterial line is recorded and displayed on the COstatus HCM101 Monitor. Cardiac output is calculated from the area of the concentration curve using the Stewart-Hamilton equation. UD is a non-invasive procedure, requiring only a connection to the AV loop and two lines from a patient. UD has been specialised for application in pediatric ICU patients and has been demonstrated to be relatively safe although invasive and reproducible.
Electrical cardiometry
Electrical cardiometry is a non-invasive method similar to Impedance cardiography; both methods measure thoracic electrical bioimpedance (TEB). The underlying model differs between the two methods; Electrical cardiometry attributes the steep increase of TEB beat-to-beat to the change in orientation of red blood cells. Four standard ECG electrodes are required for measurement of cardiac output. Electrical Cardiometry is a method trademarked by Cardiotronic, Inc., and shows promising results in a wide range of patients. It is currently approved in the US for use in adults, children and babies. Electrical cardiometry monitors have shown promise in postoperative cardiac surgical patients, in both haemodynamicially stable and unstable cases.[56]
Magnetic resonance imaging
Velocity-encoded phase contrast Magnetic resonance imaging (MRI)[57] is the most accurate technique for measuring flow in large vessels in mammals. MRI flow measurements have been shown to be highly accurate compared to measurements made with a beaker and timer,[58] and less variable than the Fick principle[59] and thermodilution.[60]
Velocity-encoded MRI is based on the detection of changes in the phase of proton precession. These changes are proportional to the velocity of the protons' movement through a magnetic field with a known gradient. When using velocity-encoded MRI, the result is two sets of images, one for each time point in the cardiac cycle. One is an anatomical image and the other is an image in which the signal intensity in each pixel is directly proportional to the through-plane velocity. The average velocity in a vessel, i.e., the aorta or the pulmonary artery, is quantified by measuring the average signal intensity of the pixels in the cross-section of the vessel then multiplying by a known constant. The flow is calculated by multiplying the mean velocity by the cross-sectional area of the vessel. This flow data can be used in a flow-versus-time graph. The area under the flow-versus-time curve for one cardiac cycle is the stroke volume. The length of the cardiac cycle is known and determines heart rate; Q can be calculated using equation (1). MRI is typically used to quantify the flow over one cardiac cycle as the average of several heart beats. It is also possible to quantify the stroke volume in real-time on a beat-for-beat basis.[61]
While MRI is an important research tool for accurately measuring Q, it is currently not clinically used for haemodynamic monitoring in emergency or intensive care settings. As of 2015, cardiac output measurement by MRI is routinely used in clinical cardiac MRI examinations.[62]
Dye dilution method
The dye dilution method is done by rapidly injecting a dye, indocyanine green, into the right atrium of the heart. The dye flows with the blood into the aorta. A probe is inserted into the aorta to measure the concentration of the dye leaving the heart at equal time intervals [0, T] until the dye has cleared. Let c(t) be the concentration of the dye at time t. By dividing the time intervals from [0, T] into subintervals Δt, the amount of dye that flows past the measuring point during the subinterval from to is:


where is the rate of flow that is being calculated. The total amount of dye is:


and, letting , the amount of dye is:


Thus, the cardiac output is given by:

where the amount of dye injected is known, and the integral can be determined using the concentration readings.[63]

The dye dilution method is one of the most accurate methods of determining cardiac output during exercise. The error of a single calculation of cardiac output values at rest and during exercise is less than 5%. This method does not allow measurement of 'beat to beat' changes, and requires a cardiac output that is stable for approximately 10 s during exercise and 30 s at rest.
Influences
Cardiac output is primarily controlled by the oxygen requirement of tissues in the body. In contrast to other pump systems, the heart is a demand pump that does not regulate its own output.[64] When the body has a high metabolic oxygen demand, the metabolically controlled flow through the tissues is increased, leading to a greater flow of blood back to the heart, leading to higher cardiac output.
The capacitance, also known as compliance, of the arterio-vascular channels that carry the blood also controls cardiac output. As the body's blood vessels actively expand and contract, the resistance to blood flow increases and decreases respectively. Thin-walled veins have about eighteen times the capacitance of thick-walled arteries because they are able to carry more blood by virtue of being more distensible.[65]
From this formula, it is clear the factors affecting stroke volume and heart rate also affect cardiac output. The figure to the right illustrates this dependency and lists a few of these factors. A more detailed hierarchical illustration is provided in a subsequent figure.
Equation (1) reveals HR and SV to be the primary determinants of cardiac output Q. A detailed representation of these factors is illustrated in the figure to the right. The primary factors that influence HR are autonomic innervation plus endocrine control. Environmental factors, such as electrolytes, metabolic products, and temperature are not shown. The determinants of SV during the cardiac cycle are the contractility of the heart muscle, the degree of preload of myocardial distention prior to shortening and the afterload during ejection.[66] Other factors such as electrolytes may be classified as either positive or negative inotropic agents.[67]
Cardiac response
| |||||||||||||||
|
Clinical significance
When Q increases in a healthy but untrained individual, most of the increase can be attributed to an increase in heart rate (HR). Change of posture, increased sympathetic nervous system activity, and decreased parasympathetic nervous system activity can also increase cardiac output. HR can vary by a factor of approximately 3—between 60 and 180 beats per minute—while stroke volume (SV) can vary between 70 and 120 ml (2.5 and 4.2 imp fl oz; 2.4 and 4.1 US fl oz), a factor of only 1.7.[68][69][70]
Diseases of the cardiovascular system are often associated with changes in Q, particularly the pandemic diseases hypertension and heart failure. Increased Q can be associated with cardiovascular disease that can occur during infection and sepsis. Decreased Q can be associated with cardiomyopathy and heart failure.[66] Sometimes, in the presence of ventricular disease associated with dilatation, EDV may vary. An increase in EDV could counterbalance LV dilatation and impaired contraction. From equation (3), the resulting cardiac output Q may remain constant. The ability to accurately measure Q is important in clinical medicine because it provides for improved diagnosis of abnormalities and can be used to guide appropriate management.[71]
Example values
| Ventricular volumes | ||
|---|---|---|
| Measure | Right ventricle | Left ventricle |
| End-diastolic volume | 144 mL(± 23 mL)[72] | 142 mL (± 21 mL)[73] |
| End-diastolic volume / body surface area (mL/m2) | 78 mL/m2 (± 11 mL/m2)[72] | 78 mL/m2 (± 8.8 mL/m2)[73] |
| End-systolic volume | 50 mL (± 14 mL)[72] | 47 mL (± 10 mL)[73] |
| End-systolic volume / body surface area (mL/m2) | 27 mL/m2 (± 7 mL/m2)[72] | 26 mL/m2 (± 5.1 mL/m2)[73] |
| Stroke volume | 94 mL (± 15 mL)[72] | 95 mL (± 14 mL)[73] |
| Stroke volume / body surface area (mL/m2) | 51 mL/m2 (± 7 mL/m2)[72] | 52 mL/m2 (± 6.2 mL/m2)[73] |
| Ejection fraction | 66% (± 6%)[72] | 67% (± 4.6%)[73] |
| Heart rate | 60–100 bpm[74] | 60–100 bpm[74] |
| Cardiac output | 4.0–8.0 L/minute[75] | 4.0–8.0 l L/minute[75] |
Related measurements
Ejection fraction
Ejection fraction (EF) is a parameter related to SV. EF is the fraction of blood ejected by the left ventricle (LV) during the contraction or ejection phase of the cardiac cycle or systole. Prior to the start of systole, during the filling phase or diastole, the LV is filled with blood to the capacity known as end diastolic volume (EDV). During systole, the LV contracts and ejects blood until it reaches its minimum capacity known as end systolic volume (ESV). It does not completely empty. The following equations help translate the effect of EF and EDV on cardiac output Q, via SV.
(3)

Cardiac input
Cardiac input (CI) is the inverse operation of cardiac output. As cardiac output implies the volumetric expression of ejection fraction, cardiac input implies the volumetric injection fraction (IF).
IF = end diastolic volume (EDV) / end systolic volume (ESV)
Cardiac input is a readily imaged mathematical model of diastole.
Cardiac index
In all resting mammals of normal mass, CO value is a linear function of body mass with a slope of 0.1 l/min/kg.[76][77] Fat has about 65% of oxygen demand per mass in comparison to other lean body tissues. As a result, the calculation of normal CO value in an obese subject is more complex; a single, common "normal" value of SV and CO for adults cannot exist. All blood flow parameters have to be indexed. It is accepted convention to index them by the Body Surface Area, BSA [m²], by DuBois & DuBois Formula, a function of height and weight:

The resulting indexed parameters are Stroke Index (SI) and Cardiac Index (CI). Stroke Index, measured in ml/beat/m², is defined as

Cardiac Index, measured in l/min/m², is defined as

The CO equation (1) for indexed parameters then changes to the following.
-
(2)

The normal range for these indexed blood flow parameters are between 35 and 65 ml/beat/m² for SI and between 2.5 and 4 l/min/m² for CI.[78]
Combined cardiac output
Combined cardiac output (CCO) is the sum of the outputs of the right and left sides of the heart. It is a useful measurement in fetal circulation, where cardiac outputs from both sides of the heart work partly in parallel by the foramen ovale and ductus arteriosus, which directly supply the systemic circulation.[79]
Historical methods
Fick principle
The Fick principle, first described by Adolf Eugen Fick in 1870, assumes the rate of oxygen consumption is a function of the rate of blood flow and the rate of oxygen picked up by the red blood cells. Application of the Fick principle involves calculating the oxygen consumed over time by measuring the oxygen concentration of venous blood and arterial blood. Q is calculated from these measurements as follows:
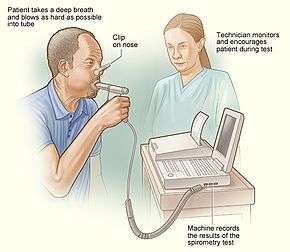
- VO2 consumption per minute using a spirometer (with the subject re-breathing air) and a CO2 absorber
- the oxygen content of blood taken from the pulmonary artery (representing mixed venous blood)
- the oxygen content of blood from a cannula in a peripheral artery (representing arterial blood)
From these values, we know that:

where
- CA is the oxygen content of arterial blood, and,
- CV is the oxygen content of venous blood.
This allows us to say

and therefore calculate Q. (CA – CV) is also known as the arteriovenous oxygen difference.[80]
While considered to be the most accurate method of measuring Q, the Fick method is invasive and requires time for sample analysis, and accurate oxygen consumption samples are difficult to acquire. There have been modifications to the Fick method where respiratory oxygen content is measured as part of a closed system and the consumed oxygen is calculated using an assumed oxygen consumption index, which is then used to calculate Q. Other variations use inert gases as tracers and measure the change in inspired and expired gas concentrations to calculate Q (Innocor, Innovision A/S, Denmark).
The calculation of the arterial and venous oxygen content of the blood is a straightforward process. Almost all oxygen in the blood is bound to hæmoglobin molecules in the red blood cells. Measuring the content of hæmoglobin in the blood and the percentage of saturation of hæmoglobin—the oxygen saturation of the blood—is a simple process and is readily available to physicians. Each gram of haemoglobin can carry 1.34 ml of O2; the oxygen content of the blood—either arterial or venous—can be estimated using the following formula:

Pulmonary artery thermodilution (trans-right-heart thermodilution)
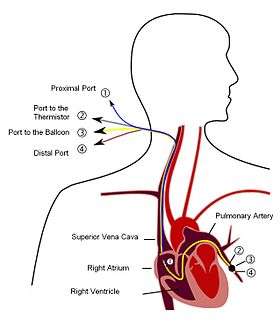
The indicator method was further developed by replacing the indicator dye with heated or cooled fluid. Temperature changes rather than dye concentration are measured at sites in the circulation; this method is known as thermodilution. The pulmonary artery catheter (PAC) introduced to clinical practice in 1970, also known as the Swan-Ganz catheter, provides direct access to the right heart for thermodilution measurements. Continuous, invasive, cardiac monitoring in intensive care units has been mostly phased out. The PAC remains useful in right-heart study done in cardiac catheterisation laboratories.
The PAC is balloon tipped and is inflated, which helps "sail" the catheter balloon through the right ventricle to occlude a small branch of the pulmonary artery system. The balloon is then deflated. The PAC thermodilution method involves the injection of a small amount (10ml) of cold glucose at a known temperature into the pulmonary artery and measuring the temperature a known distance away 6–10 cm (2.4–3.9 in) using the same catheter with temperature sensors set apart at a known distance.
The historically significant Swan-Ganz multi-lumen catheter allows reproducible calculation of cardiac output from a measured time-temperature curve, also known as the thermodilution curve. Thermistor technology enabled the observations that low CO registers temperature change slowly and high CO registers temperature change rapidly. The degree of temperature change is directly proportional to the cardiac output. In this unique method, three or four repeated measurements or passes are usually averaged to improve accuracy.[81][82] Modern catheters are fitted with heating filaments that intermittently heat up and measure the thermodilution curve, providing serial Q measurements. These instruments average measurements over 2–9 minutes depending on the stability of the circulation, and thus do not provide continuous monitoring.
PAC use can be complicated by arrhythmias, infection, pulmonary artery rupture and damage to the right heart valve. Recent studies in patients with critical illnesses, sepsis, acute respiratory failure and heart failure suggest that use of the PAC does not improve patient outcomes.[2][3][4] This clinical ineffectiveness may relate to its poor accuracy and sensitivity, which have been demonstrated by comparison with flow probes across a sixfold range of Q values.[10] Use of PAC is in decline as clinicians move to less invasive and more accurate technologies for monitoring hæmodynamics.[83]
References
- Betts JG (2013). Anatomy & physiology. pp. 787–846. ISBN 978-1938168130. Retrieved 11 August 2014.
- Binanay C, Califf RM, Hasselblad V, O'Connor CM, Shah MR, Sopko G, Stevenson LW, Francis GS, Leier CV, Miller LW (October 2005). "Evaluation study of congestive heart failure and pulmonary artery catheterization effectiveness: the ESCAPE trial". JAMA. 294 (13): 1625–33. doi:10.1001/jama.294.13.1625. PMID 16204662.
- Pasche B, Knobloch TJ, Bian Y, Liu J, Phukan S, Rosman D, Kaklamani V, Baddi L, Siddiqui FS, Frankel W, Prior TW, Schuller DE, Agrawal A, Lang J, Dolan ME, Vokes EE, Lane WS, Huang CC, Caldes T, Di Cristofano A, Hampel H, Nilsson I, von Heijne G, Fodde R, Murty VV, de la Chapelle A, Weghorst CM (October 2005). "Somatic acquisition and signaling of TGFBR1*6A in cancer". JAMA. 294 (13): 1634–46. doi:10.1001/jama.294.13.1634. PMID 16204663.
- Hall JB (October 2005). "Searching for evidence to support pulmonary artery catheter use in critically ill patients". JAMA. 294 (13): 1693–94. doi:10.1001/jama.294.13.1693. PMID 16204671.
- Finegold JA, Manisty CH, Cecaro F, Sutaria N, Mayet J, Francis DP (August 2013). "Choosing between velocity-time-integral ratio and peak velocity ratio for calculation of the dimensionless index (or aortic valve area) in serial follow-up of aortic stenosis". International Journal of Cardiology. 167 (4): 1524–31. doi:10.1016/j.ijcard.2012.04.105. PMID 22575631.
- Su BC, Yu HP, Yang MW, Lin CC, Kao MC, Chang CH, Lee WC (July 2008). "Reliability of a new ultrasonic cardiac output monitor in recipients of living donor liver transplantation". Liver Transplantation. 14 (7): 1029–37. doi:10.1002/lt.21461. PMID 18581505.
- Phillips R, Paradisis M, Evans N, Southwell D, Burstow D, West M (2006). "Cardiac output measurement in preterm neonates: validation of USCOM against echocardiography". Critical Care. 10 (Suppl 1): P343. doi:10.1186/cc4690. PMC 4092718.
- Cattermole GN, Leung PY, Mak PS, Chan SS, Graham CA, Rainer TH (September 2010). "The normal ranges of cardiovascular parameters in children measured using the Ultrasonic Cardiac Output Monitor". Critical Care Medicine. 38 (9): 1875–81. doi:10.1097/CCM.0b013e3181e8adee. PMID 20562697.
- Jain S, Allins A, Salim A, Vafa A, Wilson MT, Margulies DR (December 2008). "Noninvasive Doppler ultrasonography for assessing cardiac function: can it replace the Swan-Ganz catheter?". American Journal of Surgery. 196 (6): 961–67, discussion 967–68. doi:10.1016/j.amjsurg.2008.07.039. PMID 19095116.
- Phillips RA, Hood SG, Jacobson BM, West MJ, Wan L, May CN (2012). "Pulmonary Artery Catheter (PAC) Accuracy and Efficacy Compared with Flow Probe and Transcutaneous Doppler (USCOM): An Ovine Cardiac Output Validation". Critical Care Research and Practice. 2012: 1–9. doi:10.1155/2012/621496. PMC 3357512. PMID 22649718.
- Horster S, Stemmler HJ, Strecker N, Brettner F, Hausmann A, Cnossen J, Parhofer KG, Nickel T, Geiger S (2012). "Cardiac Output Measurements in Septic Patients: Comparing the Accuracy of USCOM to PiCCO". Critical Care Research and Practice. 2012: 1–5. doi:10.1155/2012/270631. PMC 3235433. PMID 22191019.
- Phillips R, Lichtenthal P, Sloniger J, Burstow D, West M, Copeland J (March 2009). "Noninvasive cardiac output measurement in heart failure subjects on circulatory support". Anesthesia and Analgesia. 108 (3): 881–86. doi:10.1213/ane.0b013e318193174b. PMID 19224797.
- Kager CC, Dekker GA, Stam MC (April 2009). "Measurement of cardiac output in normal pregnancy by a non-invasive two-dimensional independent Doppler device". The Australian & New Zealand Journal of Obstetrics & Gynaecology. 49 (2): 142–44. doi:10.1111/j.1479-828X.2009.00948.x. PMID 19441163.
- Mythen MG, Webb AR (April 1995). "Perioperative plasma volume expansion reduces the incidence of gut mucosal hypoperfusion during cardiac surgery". Archives of Surgery. 130 (4): 423–29. doi:10.1001/archsurg.1995.01430040085019. PMID 7535996.
- Sinclair S, James S, Singer M (October 1997). "Intraoperative intravascular volume optimisation and length of hospital stay after repair of proximal femoral fracture: randomised controlled trial". BMJ. 315 (7113): 909–12. doi:10.1136/bmj.315.7113.909. PMC 2127619. PMID 9361539.
- Conway DH, Mayall R, Abdul-Latif MS, Gilligan S, Tackaberry C (September 2002). "Randomised controlled trial investigating the influence of intravenous fluid titration using oesophageal Doppler monitoring during bowel surgery". Anaesthesia. 57 (9): 845–49. doi:10.1046/j.1365-2044.2002.02708.x. PMID 12190747.
- Gan TJ, Soppitt A, Maroof M, el-Moalem H, Robertson KM, Moretti E, Dwane P, Glass PS (October 2002). "Goal-directed intraoperative fluid administration reduces length of hospital stay after major surgery". Anesthesiology. 97 (4): 820–26. doi:10.1097/00000542-200210000-00012. PMID 12357146.
- Venn R, Steele A, Richardson P, Poloniecki J, Grounds M, Newman P (January 2002). "Randomized controlled trial to investigate influence of the fluid challenge on duration of hospital stay and perioperative morbidity in patients with hip fractures". British Journal of Anaesthesia. 88 (1): 65–71. doi:10.1093/bja/88.1.65. PMID 11881887.
- Wakeling HG, McFall MR, Jenkins CS, Woods WG, Miles WF, Barclay GR, Fleming SC (November 2005). "Intraoperative oesophageal Doppler guided fluid management shortens postoperative hospital stay after major bowel surgery". British Journal of Anaesthesia. 95 (5): 634–42. doi:10.1093/bja/aei223. PMID 16155038.
- Noblett SE, Snowden CP, Shenton BK, Horgan AF (September 2006). "Randomized clinical trial assessing the effect of Doppler-optimized fluid management on outcome after elective colorectal resection". The British Journal of Surgery. 93 (9): 1069–76. doi:10.1002/bjs.5454. PMID 16888706.
- Pillai P, McEleavy I, Gaughan M, Snowden C, Nesbitt I, Durkan G, Johnson M, Cosgrove J, Thorpe A (December 2011). "A double-blind randomized controlled clinical trial to assess the effect of Doppler optimized intraoperative fluid management on outcome following radical cystectomy". The Journal of Urology. 186 (6): 2201–06. doi:10.1016/j.juro.2011.07.093. PMID 22014804.
- http://www.nice.org.uk/mtg3%5B%5D
- Lowe GD, Chamberlain BM, Philpot EJ, Willshire RJ (2010). "Oesophageal Doppler Monitor (ODM) guided individualised goal directed fluid management (iGDFM) in surgery – a technical review" (PDF). Deltex Medical Technical Review. Archived (PDF) from the original on 23 September 2015.
- de Wilde RB, Schreuder JJ, van den Berg PC, Jansen JR (August 2007). "An evaluation of cardiac output by five arterial pulse contour techniques during cardiac surgery". Anaesthesia. 62 (8): 760–68. doi:10.1111/j.1365-2044.2007.05135.x. PMID 17635422.
- Wesseling KH, Jansen JR, Settels JJ, Schreuder JJ (May 1993). "Computation of aortic flow from pressure in humans using a nonlinear, three-element model". Journal of Applied Physiology. 74 (5): 2566–73. doi:10.1152/jappl.1993.74.5.2566. PMID 8335593.
- Bein B, Meybohm P, Cavus E, Renner J, Tonner PH, Steinfath M, Scholz J, Doerges V (July 2007). "The reliability of pulse contour-derived cardiac output during hemorrhage and after vasopressor administration". Anesthesia and Analgesia. 105 (1): 107–13. doi:10.1213/01.ane.0000268140.02147.ed. PMID 17578965.
- Singh S, Taylor MA (August 2010). "Con: the FloTrac device should not be used to follow cardiac output in cardiac surgical patients". Journal of Cardiothoracic and Vascular Anesthesia. 24 (4): 709–11. doi:10.1053/j.jvca.2010.04.023. PMID 20673749.
- Manecke GR (September 2005). "Edwards FloTrac sensor and Vigileo monitor: easy, accurate, reliable cardiac output assessment using the arterial pulse wave". Expert Review of Medical Devices. 2 (5): 523–27. doi:10.1586/17434440.2.5.523. PMID 16293062.
- McGee WT (2009). "A simple physiologic algorithm for managing hemodynamics using stroke volume and stroke volume variation: physiologic optimization program". Journal of Intensive Care Medicine. 24 (6): 352–60. doi:10.1177/0885066609344908. PMID 19736180.
- Su BC, Tsai YF, Chen CY, Yu HP, Yang MW, Lee WC, Lin CC (March 2012). "Cardiac output derived from arterial pressure waveform analysis in patients undergoing liver transplantation: validity of a third-generation device". Transplantation Proceedings. 44 (2): 424–28. doi:10.1016/j.transproceed.2011.12.036. PMID 22410034.
- Takala J, Ruokonen E, Tenhunen JJ, Parviainen I, Jakob SM (June 2011). "Early non-invasive cardiac output monitoring in hemodynamically unstable intensive care patients: a multi-center randomized controlled trial". Critical Care. 15 (3): R148. doi:10.1186/cc10273. PMC 3219022. PMID 21676229.
- Romano SM, Pistolesi M (August 2002). "Assessment of cardiac output from systemic arterial pressure in humans". Critical Care Medicine. 30 (8): 1834–41. doi:10.1097/00003246-200208000-00027. PMID 12163802.
- Scolletta S, Romano SM, Biagioli B, Capannini G, Giomarelli P (August 2005). "Pressure recording analytical method (PRAM) for measurement of cardiac output during various haemodynamic states". British Journal of Anaesthesia. 95 (2): 159–65. doi:10.1093/bja/aei154. PMID 15894561.
- Calamandrei M, Mirabile L, Muschetta S, Gensini GF, De Simone L, Romano SM (May 2008). "Assessment of cardiac output in children: a comparison between the pressure recording analytical method and Doppler echocardiography". Pediatric Critical Care Medicine. 9 (3): 310–12. doi:10.1097/PCC.0b013e31816c7151. PMID 18446106.
- Scolletta S, Gregoric ID, Muzzi L, Radovancevic B, Frazier OH (January 2007). "Pulse wave analysis to assess systemic blood flow during mechanical biventricular support". Perfusion. 22 (1): 63–66. doi:10.1177/0267659106074784. PMID 17633137.
- Scolletta S, Romano SM, Maglioni H (2005). "Left ventricular performance by PRAM during cardiac surgery". p. S157. Missing or empty
|url=(help) in "OP 564–605". Intensive Care Medicine. 31 (Suppl 1): S148–58. 2005. doi:10.1007/s00134-005-2781-3. - Bernstein, Donald P (2010). "Impedance cardiography: Pulsatile blood flow and the biophysical and electrodynamic basis for the stroke volume equations". Journal of Electrical Bioimpedance. 1: 2–17. doi:10.5617/jeb.51. Archived from the original on 17 October 2015.
- Costa PD, Rodrigues PP, Reis AH, Costa-Pereira A (December 2010). "A review on remote monitoring technology applied to implantable electronic cardiovascular devices". Telemedicine Journal and E-Health. 16 (10): 1042–50. doi:10.1089/tmj.2010.0082. PMID 21070132.
- Tang WH, Tong W (March 2009). "Measuring impedance in congestive heart failure: current options and clinical applications". American Heart Journal. 157 (3): 402–11. doi:10.1016/j.ahj.2008.10.016. PMC 3058607. PMID 19249408.
- Ferrario CM, Flack JM, Strobeck JE, Smits G, Peters C (February 2010). "Individualizing hypertension treatment with impedance cardiography: a meta-analysis of published trials". Therapeutic Advances in Cardiovascular Disease. 4 (1): 5–16. doi:10.1177/1753944709348236. PMID 20042450.
- Moshkovitz Y, Kaluski E, Milo O, Vered Z, Cotter G (May 2004). "Recent developments in cardiac output determination by bioimpedance: comparison with invasive cardiac output and potential cardiovascular applications". Current Opinion in Cardiology. 19 (3): 229–37. doi:10.1097/00001573-200405000-00008. PMID 15096956.
- Parry MJ, McFetridge-Durdle J (2006). "Ambulatory impedance cardiography: a systematic review". Nursing Research. 55 (4): 283–91. doi:10.1097/00006199-200607000-00009. PMID 16849981.
- Wang DJ, Gottlieb SS (September 2006). "Impedance cardiography: more questions than answers". Current Heart Failure Reports. 3 (3): 107–13. doi:10.1007/s11897-006-0009-7. PMID 16914102.
- Ventura HO, Taler SJ, Strobeck JE (February 2005). "Hypertension as a hemodynamic disease: the role of impedance cardiography in diagnostic, prognostic, and therapeutic decision making". American Journal of Hypertension. 18 (2 Pt 2): 26S–43S. doi:10.1016/j.amjhyper.2004.11.002. PMID 15752931.
- "Archived copy". Archived from the original on 3 December 2010. Retrieved 30 November 2010.CS1 maint: archived copy as title (link)
- "Niccomo – Non-Invasive Continuous Cardiac Output Monitor". www.medis-de.com. medis. GmbH Ilmenau. Archived from the original on 17 October 2015. Retrieved 1 June 2015.
- "Archived copy". Archived from the original on 24 May 2015. Retrieved 22 May 2015.CS1 maint: archived copy as title (link) TEBCO OEM
- bomed.us/ext-teb.html EXT-TEBCO
- Krivitski NM (July 1995). "Theory and validation of access flow measurement by dilution technique during hemodialysis". Kidney International. 48 (1): 244–50. doi:10.1038/ki.1995.290. PMID 7564085.
- Tanke RB, van Heijst AF, Klaessens JH, Daniels O, Festen C (January 2004). "Measurement of the ductal L-R shunt during extracorporeal membrane oxygenation in the lamb". Journal of Pediatric Surgery. 39 (1): 43–47. doi:10.1016/j.jpedsurg.2003.09.017. PMID 14694369.
- Casas F, Reeves A, Dudzinski D, Weber S, Lorenz M, Akiyama M, Kamohara K, Kopcak M, Ootaki Y, Zahr F, Sinkewich M, Foster R, Fukamachi K, Smith WA (2005). "Performance and reliability of the CPB/ECMO Initiative Forward Lines Casualty Management System". ASAIO Journal. 51 (6): 681–85. doi:10.1097/01.mat.0000182472.63808.b9. PMID 16340350.
- Tessitore N, Bedogna V, Poli A, Mantovani W, Lipari G, Baggio E, Mansueto G, Lupo A (November 2008). "Adding access blood flow surveillance to clinical monitoring reduces thrombosis rates and costs, and improves fistula patency in the short term: a controlled cohort study". Nephrology, Dialysis, Transplantation. 23 (11): 3578–84. doi:10.1093/ndt/gfn275. PMID 18511608.
- van Loon M, van der Mark W, Beukers N, de Bruin C, Blankestijn PJ, Huisman RM, Zijlstra JJ, van der Sande FM, Tordoir JH (June 2007). "Implementation of a vascular access quality programme improves vascular access care". Nephrology, Dialysis, Transplantation. 22 (6): 1628–32. doi:10.1093/ndt/gfm076. PMID 17400567.
- (COstatus Archived 12 May 2015 at the Wayback Machine, Transonic System Inc. Archived 29 October 2008 at the Wayback Machine Ithaca, NY)
- Krivitski NM, Kislukhin VV, Thuramalla NV (July 2008). "Theory and in vitro validation of a new extracorporeal arteriovenous loop approach for hemodynamic assessment in pediatric and neonatal intensive care unit patients". Pediatric Critical Care Medicine. 9 (4): 423–28. doi:10.1097/01.PCC.0b013e31816c71bc. PMC 2574659. PMID 18496416.
- Funk DJ, Moretti EW, Gan TJ (March 2009). "Minimally invasive cardiac output monitoring in the perioperative setting". Anesthesia and Analgesia. 108 (3): 887–97. doi:10.1213/ane.0b013e31818ffd99. PMID 19224798.
- Arheden H, Ståhlberg F (2006). "Blood flow measurements". In de Roos A, Higgins CB (eds.). MRI and CT of the Cardiovascular System (2nd ed.). Hagerstwon, MD: Lippincott Williams & Wilkins. pp. 71–90. ISBN 978-0-7817-6271-7.
- Arheden H, Holmqvist C, Thilen U, Hanséus K, Björkhem G, Pahlm O, Laurin S, Ståhlberg F (May 1999). "Left-to-right cardiac shunts: comparison of measurements obtained with MR velocity mapping and with radionuclide angiography". Radiology. 211 (2): 453–58. doi:10.1148/radiology.211.2.r99ma43453. PMID 10228528.
- Razavi R, Hill DL, Keevil SF, Miquel ME, Muthurangu V, Hegde S, Rhode K, Barnett M, van Vaals J, Hawkes DJ, Baker E (December 2003). "Cardiac catheterisation guided by MRI in children and adults with congenital heart disease". Lancet. 362 (9399): 1877–82. doi:10.1016/S0140-6736(03)14956-2. PMID 14667742.
- Kuehne T, Yilmaz S, Schulze-Neick I, Wellnhofer E, Ewert P, Nagel E, Lange P (August 2005). "Magnetic resonance imaging guided catheterisation for assessment of pulmonary vascular resistance: in vivo validation and clinical application in patients with pulmonary hypertension". Heart. 91 (8): 1064–69. doi:10.1136/hrt.2004.038265. PMC 1769055. PMID 16020598.
- Petzina R, Ugander M, Gustafsson L, Engblom H, Sjögren J, Hetzer R, Ingemansson R, Arheden H, Malmsjö M (May 2007). "Hemodynamic effects of vacuum-assisted closure therapy in cardiac surgery: assessment using magnetic resonance imaging". The Journal of Thoracic and Cardiovascular Surgery. 133 (5): 1154–62. doi:10.1016/j.jtcvs.2007.01.011. PMID 17467423.
- Pennell DJ, Sechtem UP, Higgins CB, Manning WJ, Pohost GM, Rademakers FE, van Rossum AC, Shaw LJ, Yucel EK (November 2004). "Clinical indications for cardiovascular magnetic resonance (CMR): Consensus Panel report". European Heart Journal. 25 (21): 1940–65. doi:10.1016/j.ehj.2004.06.040. PMID 15522474.
- Stewart J (2010). Calculus: Early Transcententals. Cengage Learning. pp. 565–66. ISBN 9780538497909.
- Sircar S (2008). Principles of Medical Physiology. Thieme. p. 237. ISBN 978-1-58890-572-7.
- Young DB (2010). Control of Cardiac Output. Morgan & Claypool Publishers. p. 4. ISBN 978-1-61504-021-6.
- Vincent JL (2008). "Understanding cardiac output". Critical Care. 12 (4): 174. doi:10.1186/cc6975. PMC 2575587. PMID 18771592.
- Betts JG (2013). Anatomy & physiology. pp. 787–846. ISBN 978-1938168130. Retrieved 11 August 2014.
- Levy MN, Berne RM (1997). Cardiovascular physiology (7th ed.). St. Louis: Mosby. ISBN 978-0-8151-0901-3.
- Rowell, Loring B. (1993). Human cardiovascular control. Oxford: Oxford University Press. ISBN 978-0-19-507362-1.
- Braunwald E (1997). Heart disease: a textbook of cardiovascular medicine (5th ed.). Philadelphia: Saunders. ISBN 978-0-7216-5666-3.
- Dhingra VK, Fenwick JC, Walley KR, Chittock DR, Ronco JJ (September 2002). "Lack of agreement between thermodilution and fick cardiac output in critically ill patients". Chest. 122 (3): 990–97. doi:10.1378/chest.122.3.990. PMID 12226045.
- Maceira AM, Prasad SK, Khan M, Pennell DJ (December 2006). "Reference right ventricular systolic and diastolic function normalized to age, gender and body surface area from steady-state free precession cardiovascular magnetic resonance" (PDF). European Heart Journal. 27 (23): 2879–88. doi:10.1093/eurheartj/ehl336. PMID 17088316.
- Maceira A (2006). "Normalized Left Ventricular Systolic and Diastolic Function by Steady State Free Precession Cardiovascular Magnetic Resonance". Journal of Cardiovascular Magnetic Resonance. 8: 417–426. doi:10.1080/10976640600572889. (subscription required)
- Normal ranges for heart rate are among the narrowest limits between bradycardia and tachycardia. See the Bradycardia and Tachycardia articles for more detailed limits.
- "Normal Hemodynamic Parameters – Adult" (PDF). Edwards Lifesciences LLC. 2009.
- WR Milnor: Hemodynamics, Williams & Wilkins, 1982
- BB Sramek: Systemic Hemodynamics and Hemodynamic Management, 2002, ISBN 1-59196-046-0
- "Cardiac Output and Cardiac Index - What's the diffference?". 13 December 2016. Retrieved 14 December 2018.
- Boron WF (2003). Medical Physiology: A Cellular And Molecular Approaoch. Elsevier/Saunders. p. 1197. ISBN 978-1-4160-2328-9.
- "Arteriovenous oxygen difference". Sports Medicine, Sports Science and Kinesiology. Net Industries. 2011. Archived from the original on 12 June 2011. Retrieved 30 April 2011.
- Iberti TJ, Fischer EP, Leibowitz AB, Panacek EA, Silverstein JH, Albertson TE (December 1990). "A multicenter study of physicians' knowledge of the pulmonary artery catheter. Pulmonary Artery Catheter Study Group". JAMA. 264 (22): 2928–32. doi:10.1001/jama.264.22.2928. PMID 2232089.
- Johnston IG, Jane R, Fraser JF, Kruger P, Hickling K (August 2004). "Survey of intensive care nurses' knowledge relating to the pulmonary artery catheter". Anaesthesia and Intensive Care. 32 (4): 564–68. doi:10.1177/0310057X0403200415. PMID 15675218.
- Alhashemi JA, Cecconi M, Hofer CK (2011). "Cardiac output monitoring: an integrative perspective". Critical Care. 15 (2): 214. doi:10.1186/cc9996. PMC 3219410. PMID 21457508.