

Current Cigarette Smoking Among Adults in the United States
 ShareCompartir
Cigarette smoking is the leading cause of preventable disease and death in the United States, accounting for more than 480,000 deaths every year, or 1 of every 5 deaths.1
In 2015, about 15 of every 100 U.S. adults aged 18 years or older (15.1%) currently* smoked cigarettes. This means an estimated 36.5 million adults in the United States currently smoke cigarettes.2 More than 16 million Americans live with a smoking-related disease.2
Current smoking has declined from nearly 21 of every 100 adults (20.9%) in 2005 to about 15 of every 100 adults (15.1%) in 2015.2
*Current smokers are defined as persons who reported smoking at least 100 cigarettes during their lifetime and who, at the time they participated in a survey about this topic, reported smoking every day or some days.
Current Smoking Among Adults in 2015 (Nation)
By Gender2
Men were more likely to be current cigarette smokers than women.
- Nearly 17 of every 100 adult men (16.7%)
- More than 13 of every 100 adult women (13.6%)
By Age2
Current cigarette smoking was higher among persons aged 18–24 years, 25–44 years, and 45–64 years than among those aged 65 years and older.
- 13 of every 100 adults aged 18–24 years (13.0%)
- Nearly 18 of every 100 adults aged 25–44 years (17.7%)
- 17 of every 100 adults aged 45–64 years (17.0%)
- More than 8 of every 100 adults aged 65 years and older (8.4%)
By Race/Ethnicity2
Current cigarette smoking was highest among non-Hispanic American Indians/Alaska Natives and people of multiple races and lowest among Asians.
- Nearly 22 of every 100 non-Hispanic American Indians/Alaska Natives (21.9%)
- More than 20 of every 100 non-Hispanic multiple race individuals (20.2%)
- Nearly 17 of every 100 non-Hispanic Blacks (16.7%)
- More than 16 of every 100 non-Hispanic Whites (16.6%)
- More than 10 of every 100 Hispanics (10.1%)
- 7 of every 100 non-Hispanic Asians* (7.0%)
*Non-Hispanic Asians does not include Native Hawaiians or Other Pacific Islanders.
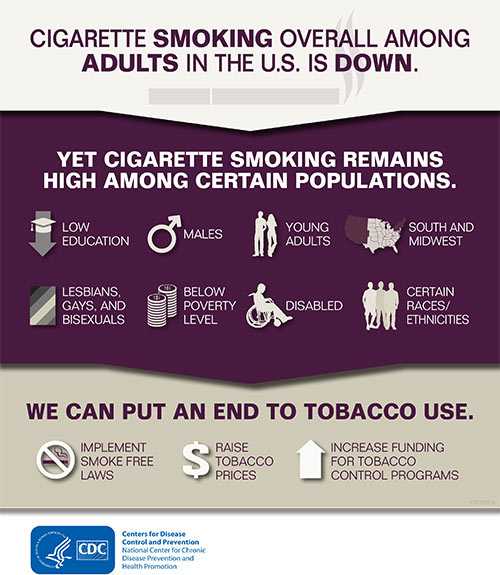
Cigarette Smoking Overall Among Adults In The U.S. Is Down
Larger infographic
By Education2
Current cigarette smoking was highest among persons with a graduate education degree certificate (GED) and lowest among those with a graduate degree.
- More than 24 of every 100 adults with 12 or fewer years of education (no diploma) (24.2%)
- About 34 of every 100 adults with a GED certificate (34.1%)
- Nearly 20 of every 100 adults with a high school diploma (19.8%)
- More than 18 of every 100 adults with some college (no degree) (18.5%)
- More than 16 of every 100 adults with an associate's degree (16.6%)
- More than 7 of every 100 adults with an undergraduate college degree (7.4%)
- More than 3 of every 100 adults with a graduate degree (3.6%)
By Poverty Status2
Current cigarette smoking was higher among persons living below the poverty* level than those living at or above this level.
- About 26 of every 100 adults who live below the poverty level (26.1%)
- Nearly 14 of every 100 adults who live at or above the poverty level (13.9%)
*Poverty thresholds are based on U.S. Census Bureau data.
By U.S. Census Region2
Current cigarette smoking was highest in the Midwest and lowest in the West.
- Nearly 19 of every 100 adults who live in the Midwest (18.7%)
- More than 15 of every 100 adults who live in the South (15.3%)
- More than 13 of every 100 adults who live in the Northeast (13.5%)
- More than 12 of every 100 adults who live in the West (12.4%)
By Disability/Limitation2
Current cigarette smoking was higher among persons with a disability/limitation than among those with no disability/limitation.
- More than 21 of every 100 adults who reported having a disability/limitation (21.5%)
- Nearly 14 of every 100 adults who reported having no disability/limitation (13.8%)
By Sexual Orientation2
Lesbian/gay/bisexual adults were more likely to be current smokers than straight adults.
- More than 20 of every 100 lesbian/gay/bisexual adults (20.6%)
- Nearly 15 of every 100 straight adults (14.9%)
Current Smoking Among Adults in 2015 (States)
- In 2015, current smoking ranged from about 9 of every 100 adults in Utah (9.1%) to nearly 26 of every 100 adults in Kentucky (25.9%).3
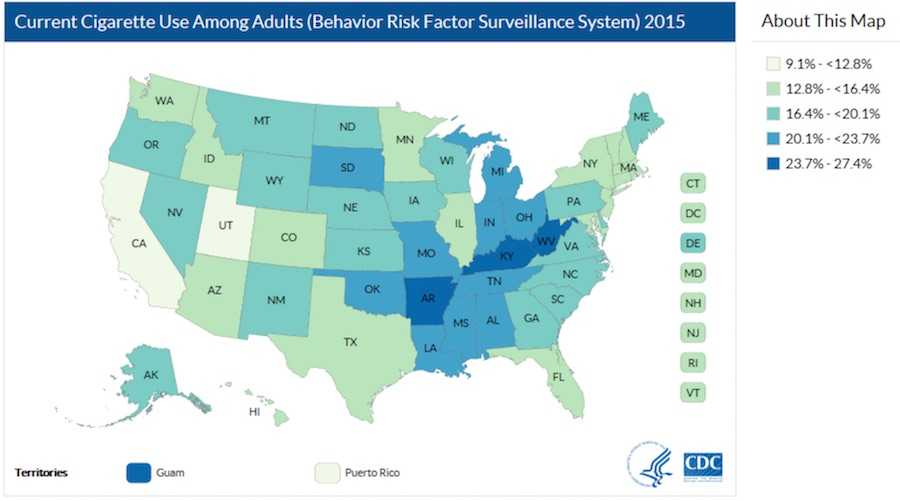
The figure presents the percentage of adults in each state who were current smokers in 2015.3
Note: These data are periodically updated on the following CDC Web sites:
References
- U.S. Department of Health and Human Services. The Health Consequences of Smoking—50 Years of Progress: A Report of the Surgeon General. Atlanta: U.S. Department of Health and Human Services, Centers for Disease Control and Prevention, National Center for Chronic Disease Prevention and Health Promotion, Office on Smoking and Health, 2014 [accessed 2016 Nov 14].
- Centers for Disease Control and Prevention. Cigarette Smoking Among Adults—United States, 2005–2015. Morbidity and Mortality Weekly Report 2016;65(44):1205–11 [accessed 2016 Nov 14].
- Centers for Disease Control and Prevention . State Tobacco Activities Tracking & Evaluation (STATE) System. Map of Current Cigarette Use Among Adults (Behavioral Risk Factor Surveillance System) 2015. Map of Current Cigarette Use Among Adults (Behavior Risk Factor Surveillance System) 2014 [accessed 2016 Nov 14].
For Further Information
Centers for Disease Control and Prevention
National Center for Chronic Disease Prevention and Health Promotion
Office on Smoking and Health
E-mail: tobaccoinfo@cdc.gov
Phone: 1-800-CDC-INFO
Media Inquiries: Contact CDC's Office on Smoking and Health press line at 770-488-5493.
- Page last reviewed: December 1, 2016
- Page last updated: December 1, 2016
- Content source: