


NOISE AND HEARING LOSS PREVENTION
 ShareCompartir
Facts and Statistics
Tables, Charts, and Graphs
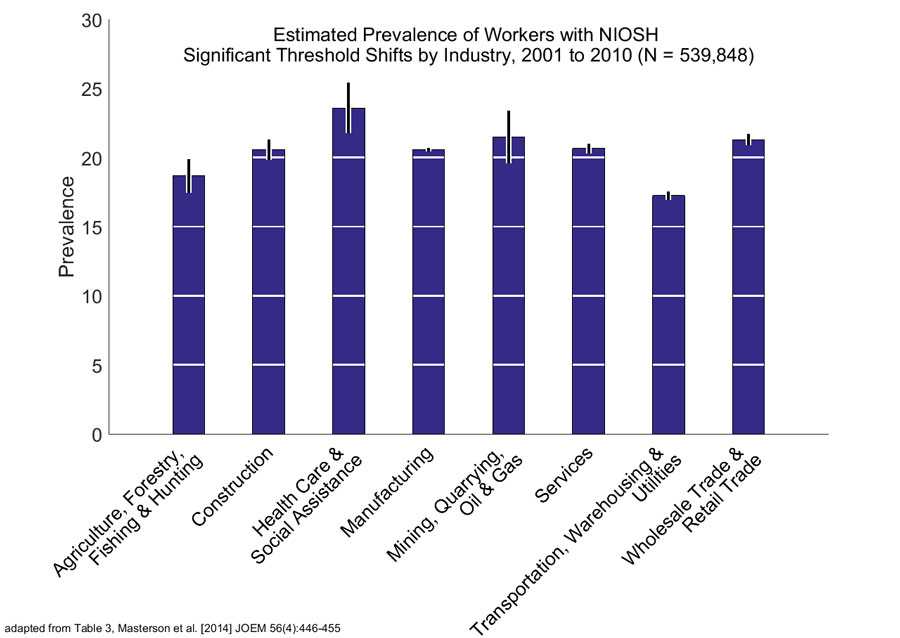
Chart depicting the estimated prevalence of workers with NIOSH significant threshold shifts by industry, 2001 – 2010.
- Page last reviewed: October 19, 2016
- Page last updated: December 7, 2016
- Content source:
- National Institute for Occupational Safety and Health Division of Applied Research and Technology