

Factors Affecting the Health of People with Disabilities and without Disabilities Graph
 ShareCompartir
Factors Affecting the Health of People with Disabilities and without Disabilities
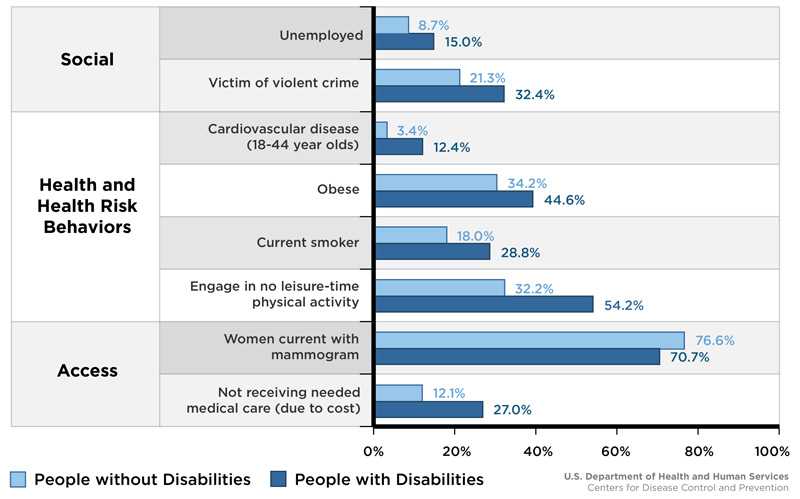
By percentage a comparison of people without disabilities compared to people with disabilities, affected by the listed factors. Three main listed factors include Social, Health and Health Risk Behaviors, and Access.
Social
For the issue of being Unemployed,
- People without Disabilities are less likely to be unemployed at 8.7%, as compared to People with Disabilities, who are more likely to be unemployed at 15.0%.
For the issue of Victim of violent crime,
- People without Disabilities are less likely to be a victim of violent crime at 21.3%, as compared to People with Disabilities more likely to be a victim of violent crime at 32.4%.
Health and Health Risk Behaviors
For the issue of Cardiovascular disease (18-44 year olds),
- People without Disabilities are less likely to have cardiovascular disease at 3.4%, as compared to People with Disabilities, who are more likely to have cardiovascular disease at 12.4%.
For the issue of the likelihood of being Obese,
- People without Disabilities are less likely to be obese at 34.2%, as compared to People with Disabilities, who are more likely to be obese at 44.6%
For the issue of the likelihood of being a Current Smoker,
- People without Disabilities are less likely to be a current smoker at 18.0%, as compared to People with Disabilities who are more likely to be smokers at 28.8%
For the issue of likelihood to Engage in no leisure-time physical activity,
- People without Disabilities are less likely to engage in no leisure-time physical activity at 32.2%, as compared to People with Disabilities who are more likely to engage in no leisure-time physical activity at 54.2%.
Access
For the issue of Women Current with mammogram,
- People without Disabilities were more likely to be Women current with mammogram at 76.6%, as compared to People with Disabilities, who are less likely to be Women current with mammogram at 70.7%.
For the issue of Not receiving needed medical care (due to cost)
- For People without Disabilities the likelihood is less that they are not receiving needed medical care (due to cost) at 12.1%, as compared to People with Disabilities who are more likely not receiving needed medical care (due to cost) at 27.0%.
- Page last reviewed: March 17, 2015
- Page last updated: March 17, 2015
- Content source: