


Disability Impacts All of Us
 ShareCompartir
Download:
Disability Impacts All of Us [PDF – 678 KB]
Description
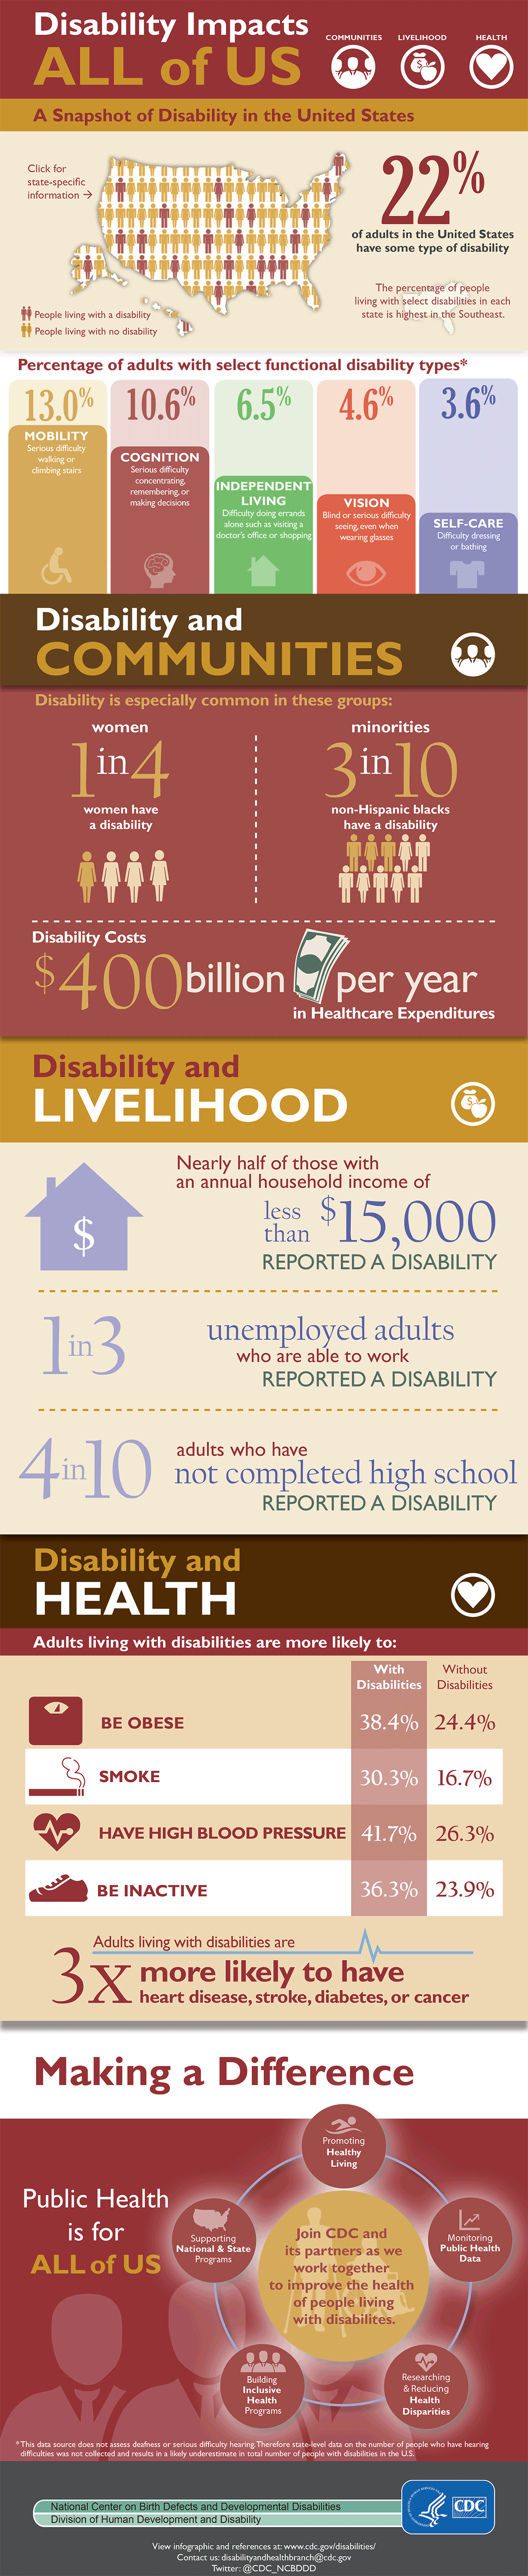
Title: Disability Impacts all of us
- Communities
- Livelihood
- Health
A snapshot of disability in the United States.
- 22 percent of adults in the United States have some type of disability. Graphic of the United States.
- The percentage of people living with select disabilities in each state is highest in the Southeast.
Percentage of adults with select functional disability types*:
- 13 percent of people with a disability have a mobility disability with serious difficulty walking or climbing stairs.
- 10.6 percent of people with a disability have a cognition disability with serious difficulty concentrating, remembering or making decisions.
- 6.5 percent of people with a disability have an independent living disability with difficulty doing errands alone such as visiting a doctor’s office or shopping.
- 4.6 percent of people with a disability have a vision disability with blindness or serious difficulty seeing even when wearing glasses.
- 3.6 percent of people with a disability have a self-care disability with difficulty dressing or bathing.
Disability and communities.
Disability is especially common in these two groups, women and minorites.
- 1 in 4 women has a disability.
- 3 in 10 non-Hispanic Americans have a disability.
Disability costs 400 billion dollars per year in health care expenditures.
Disability and livelihood.
- Nearly half of those with an annual household income of less than 15,000 dollars reported a disability.
- 1 in 3 unemployed adults who are able to work reported a disability.
- 4 in 10 adults who have not completed high school reported a disability.
Disability and health.
Adults with disabilities are more likely to be obese, smoke, have high blood pressure and be inactive:
- 38.4 percent of adults with a disability are obese while 24.4 percent of adults without a disability are obese.
- 30.3 percent of adults with a disability smoke while 16.7 percent of adults without a disability smoke.
- 41.7 percent of adults with a disability have high blood pressure while 26.3 percent of adults without a disability have high blood pressure.
- 36.3 percent of adults with a disability are inactive while 23.9 percent of adults with a disability are inactive.
Adults with disabilities are 3 times more likely to have heart disease, stroke, diabetes or cancer.
Making a difference.
Public health is for all of us.
Join CDC and its partners as we work together to improve the health of people with disabilities.
CDC and its partners work together to improve the lives of people with disabilities by:
- Promoting healthy living,
- Monitoring public health data
- Research and reducing health disparities
- Building inclusive health program
- Supporting national and state programs.
* This data source does not assess deafness or serious difficulty hearing. Therefore state-level data on the number of people who have hearing difficulties was not collected and results in a likely underestimate in total number of people with disabilities in the U.S.
Brought to you by the National Center on Birth Defects and Developmental Disabilities. The Division of Human Development and Disability.
For more information go to: www.cdc.gov/disabilities/
Contact us: disabilityandhealthbranch@cdc.gov
Follow us on twitter@cdc_ncbddd
References
- Courtney-Long EA, Carroll DD, Zhang Q, et al. Prevalence of Disability and Disability Type among Adults, United States – 2013. MMWR Morb Mortal Wkly Rep 2015; 64: 777-783.
- Anderson WL, Armour BS, Finkelstein EA, Wiener JM. Estimates of State-Level Health-Care Expenditures Associated with Disability. 2010 Public Health Rep2010;125:44–51.
- Centers for Disease Control and Prevention. Disability and Health Data System (DHDS) [Internet]. [updated 2014 November 13; cited year month date]. Available from: http://dhds.cdc.gov
- Carroll DD, Courtney-Long EA, Stevens AC, et al. Vital Signs: Disability and Physical Activity — United States, 2009–2012. MMWR Morb Mortal Wkly Rep 2014;63:407–13.
Notes
Report Limitation: Currently, the BRFSS does not assess deafness or serious difficulty hearing. Therefore data on the number of people who have hearing difficulties at the state level was not collected. This results in a likely underestimate of the total number of people with disabilities in the U.S. presented in this report.
- Page last reviewed: July 18, 2017
- Page last updated: July 18, 2017
- Content source: