WISQARS™ Tutorials: Years of Potential Life Lost
WISQARS Tutorials
Years of Potential Life Lost
Report OptionsAdvanced Options
Practice Question
WISQARS YPLL Reports calculate the years lost, by region or state, based on race and type of death.
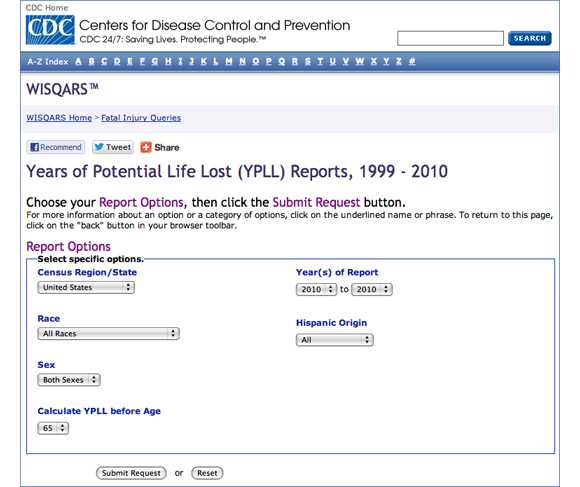
Report Options
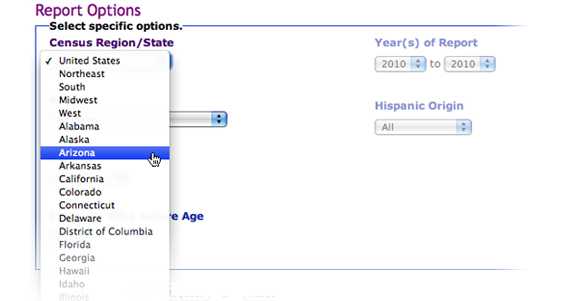
Under Report Options, the first choice is for Census Region/State. For our example we will choose the state of Arizona.
Next we will choose the Race. For our example we will select American Indian/Alaska Native.

For the next report option, Sex, we will leave the default of Both Sexes.

The option of Calculate YPLL before Age allows you to designate the age before which a premature death results in YPLL. For our example we will select the age of 70.

Next we can choose the Year(s) of Report. Since we are limiting our results by selecting only one state, for our example we will increase our sampling by choosing the years 2000 to 2010.

Finally under Hispanic Origin we will retain the default selection of All.
You have the option at this point to submit your request, reset your options, or proceed to a series of optional Advanced Options. We will skip the submit step for now and take a closer look at the Advanced Options.
Advanced Options
The Statistics Reported option allows you to request one of the following statistics: the YPLL, the crude rate of YPLL per 100,000 population, and the age-adjusted rate of YPLL per 100,000. For our example we will keep the default of YPLL. We will also retain the default year of 2000 for the Standard Year (for age-adjusting).

The next option is to Choose the subject of the report. The choice is given between Leading Causes of Death and the Number of Causes, or to compile data from Specific Injury Category. The options for Leading Causes of Death are shown here, but we will forego this option and select the Specific Injury Category.

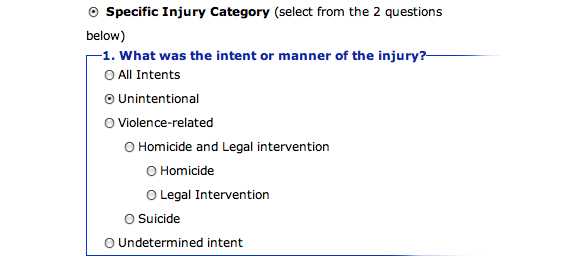
Once we have opted for the Specific Injury Category, we must answer two questions. First, What was the intent or manner of the injury? For our example we will select Unintentional.
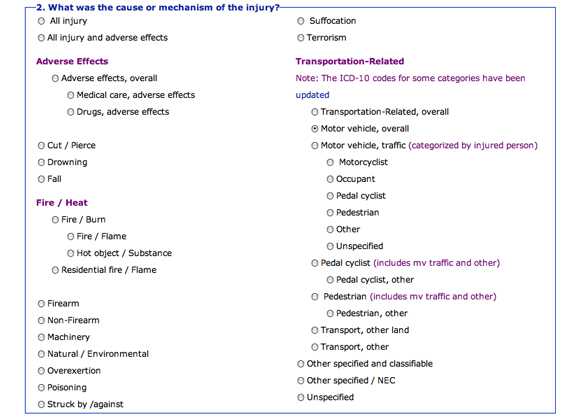
Second, What was the cause or mechanism of the injury? We will choose Motor vehicle, overall.
Now that all our selections have been made, we can submit our request.
![]()
The resulting data look like this. Results can be downloaded in a spreadsheet as a CSV file.

Practice Question
Now that you have familiarized yourself with the YPLL module of the WISQARS tutorial, put your knowledge to the test by answering the following questions:
Question 1: What are the top two causes of death (highest number of YPLL) for default options in the year 2010?
Hint: Find this by selecting the default options in the year 2010 and clicking the "submit request" button.
Answer: 1) Unintentional Injuries, and 2) Malignant Neoplasms (cancer).
Question 2: What are the top two causes of death (highest number of YPLL) for American Indians and Alaska Natives in the year 2010?
Answer: 1) Unintentional Injuries, 2) Suicide.
- Page last reviewed: February 21, 2014
- Page last updated: February 25, 2014
- Content source:
- Centers for Disease Control and Prevention, National Center for Injury Prevention and Control


 ShareCompartir