

WISQARS™ Tutorials: Fatal Injury Mapping
 ShareCompartir
WISQARS Tutorials
Fatal Injury Mapping
Injury Type OptionsScope of Map
Demographic Subsetting Options
Death Rate Calculation
Cost of Injury Option
Map Detail Options
Submit
Practice Question
WISQARS Fatal Injury Mapping allows you to show injury data on a map, which can help illustrate a number of things, such as how certain areas can be impacted by a specific type of injury or where prevention efforts should be focused.
To create a map, you must make decisions about what data you want to show and how you want to narrow or expand it to best suit your needs or the interest of the audience.
On the Fatal Injury Mapping page, you will be asked to define the following elements, which will be displayed on the finished map.
- Type, intent and mechanism of injury (Injury Type Options)
- State or region and span of years for the data (Scope of Map)
- Population affected (Demographic Subsetting Options)
- Type of death rate and whether the map should show state or county jurisdictions (Death Rate Calculation Options)
- The ranking and number of intervals for the data and the colors used (Map Detail Options)
Each of these elements and the process for defining them is explained in detail below.
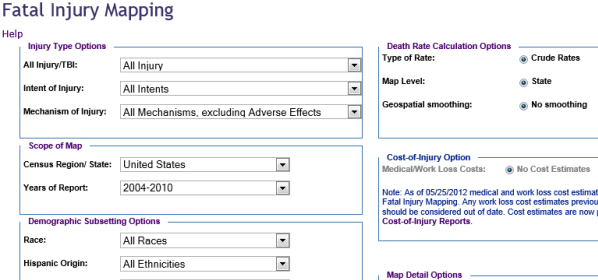
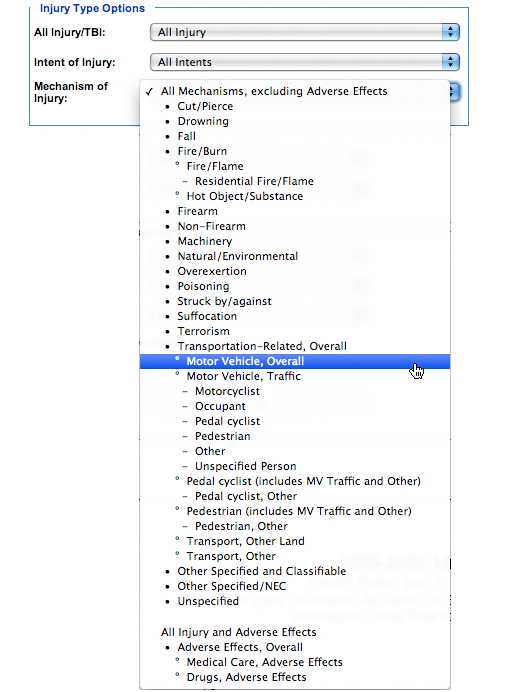
Injury Type Options
In the Injury Type Options section you will make three selections that pertain to the type of injury you wish to map. In each case, you will make your selection by clicking on the arrow to the right of each box and highlighting your choice. If you do nothing, the map will display the default selection which is shown in the box.
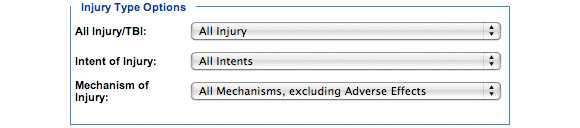
In the first box, you may choose whether the map should include all injury deaths or only those deaths associated with traumatic brain injury (TBI).
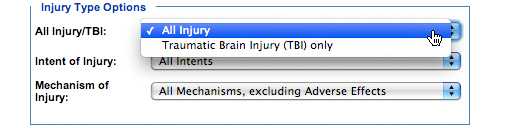
In the second box, you may indicate the intent (manner) of injury deaths you want your map to include. Your options include unintentional, undetermined (the intent could not be determined) or intentional, meaning that the injury was the result of an action that was meant to hurt someone or oneself. Intentional injuries include suicides, homicides and legal interventions (injuries inflicted by police, soldiers, or government agents).
The third box allows you to select the mechanism or process that delivered the fatal injury. There is a long list of options in this box, and therefore you may have to scroll down to view all of your choices.
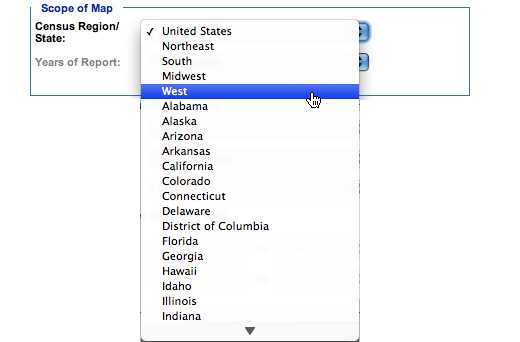
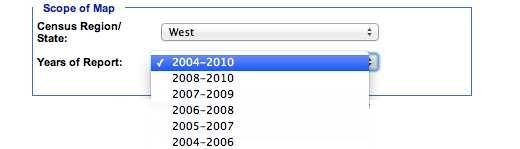
Scope of Map
In the Scope of Map section you will select the geographic area as well as the time frame you wish to map.
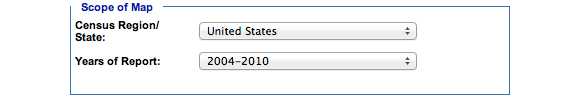
First select the region or state. For our example we have selected 'West.'
Next, select the Years of Report. We chose the default range of 2004-2010.
Demographic Subsetting Options
Under the Demographic Subsetting Options you can narrow the map to show information about a specific group of people.
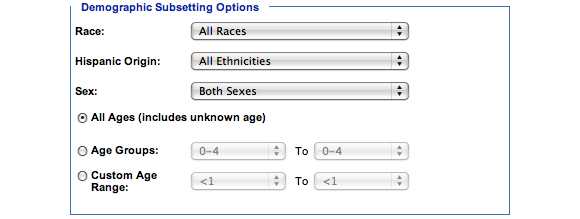
Race
You can choose from among six different racial categories. We have chosen American Indian/ Alaska Native (AI/AN).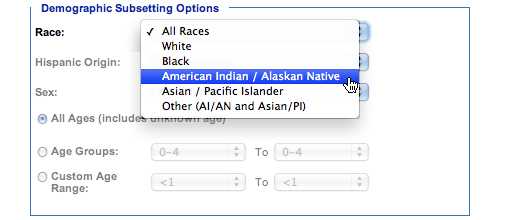
Hispanic Origin
Here you can narrow your map to include only people of Hispanic origin, to exclude people of Hispanic origin or to include people of all ethnicities. Hispanic category include people of Mexican, Puerto Rican, Cuban, Central and South American or other unknown Spanish origin. Persons of Hispanic origin may be of any race. We will choose All Ethnicities.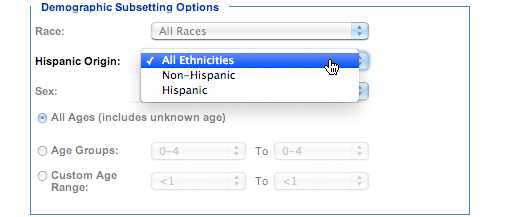
Sex
You can further narrow your map to track injury victims of only one sex. We will track injuries for both males and females.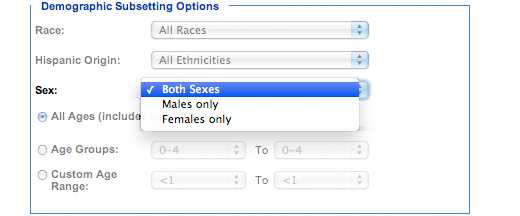
Age
You can track injuries to people of all ages.
You can choose from a number of pre-determined age groups or you can customize an age group by selecting Custom Age and choosing a starting and ending age to track with your map.
We will go with the default setting, which is all ages.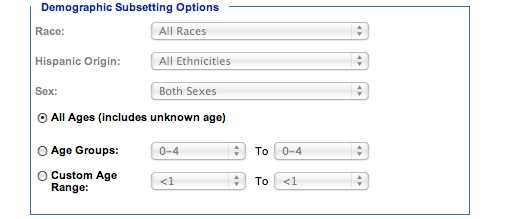
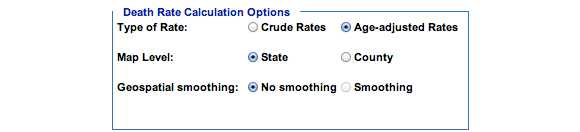
Death Rate Calculation
In the Death Rate Calculations area you will choose how the rates are calculated, whether you want your map to show you injury deaths by state or county, and whether or not you want geospatial smoothing for your map. We will change the default to select Age-adjusted Rates, but leave the default settings for County level map and Geospatial smoothing.
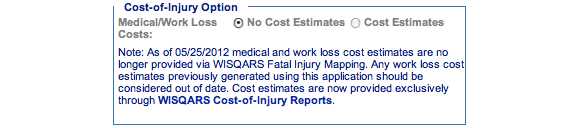
Cost of Injury Option
You will not be able to map the cost of injuries here. Cost estimates are now provided exclusively through WISQARS Cost-of-Injury Reports.
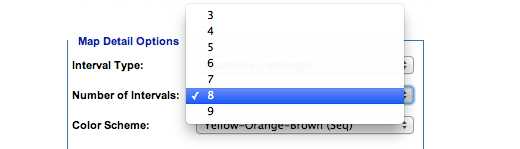
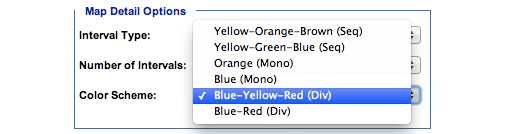
Map Detail Options
In the Map Detail Options section you will be able to determine how your map will look.
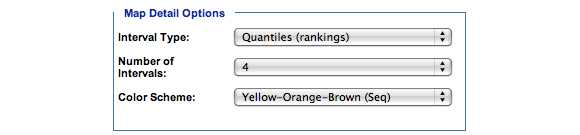
There is only one selection to be made under Interval Type. Below that, you can choose how many intervals you want your map to show. We will choose 8.
And finally, you can select the color scheme for you map. We will choose Blue-Yellow-Red (DIV).
Submit
When you have made all your selections, click Submit/Generate Map
![]()
The map generated with the options selected as described above will look like this:
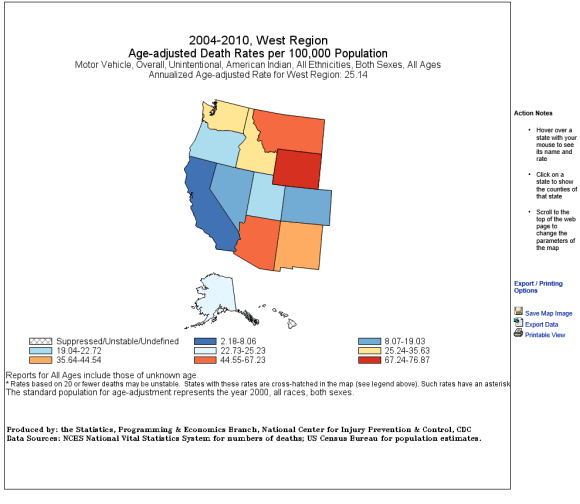
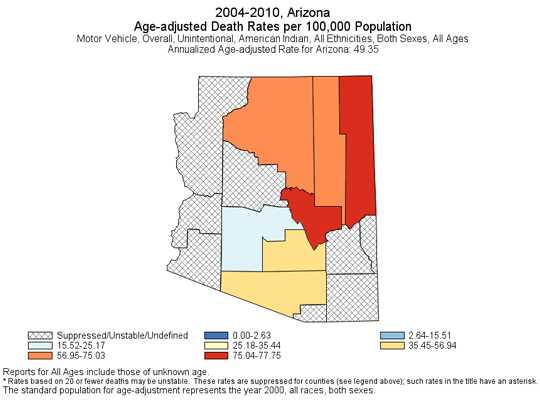
Note the Action Notes to the right side of the map. If you want to see the injuries mapped by county you can click on the state. For this example, clicking on the state of Arizona results in the following map of counties. If you want to change your map, you can scroll to the top of the page, make different selections and click Submit again.
Note: Some browsers may not display all features such as hover. To get all available information, you may export and download data.
Below the Action Notes you will find the Export/Printing Options through which you may save the map image, export the data or open a printable view of your map.
Practice Questions
Now that you have familiarized yourself with the Fatal Injury Mapping module of the WISQARS tutorial, put your knowledge to the test by generating a report with the following objective:
Question 1: Among American Indian/Alaska Native males for the years 2004-2006, what is the annualized age-adjusted rate of overall motor vehicle deaths?
Your query should have produced the result of an annualized, age-adjusted rate of 32.66.
Follow-up: What is the American Indian/Alaska Native male annualized age-adjusted rate of overall motor vehicle deaths for the years 2006-2008? Is the rate trending up or down?
The query for 2006-2008 should have produced the result of 28.65, so the rate is trending down.
Question 2: Among the American Indian/Alaska Native population, all ages, male and female, for the years 2008-2010, what is the annualized age-adjusted rate for traumatic brain injury (TBI)?
Your query should have produced the result of 16.32.
- Page last reviewed: September 2, 2014
- Page last updated: September 2, 2014
- Content source:
- Centers for Disease Control and Prevention, National Center for Injury Prevention and Control