

Graphics
 ShareCompartir
All of the following graphics are provided as a digital image (.jpg or .png formats) at a resolution that is acceptable for electronic and office print use.
Antibiotic Development

Antibiotic Development is Dwindling
Target Audience: General public
This graphic shows how the number of antibiotics being developed has steadily been decreasing since the 1980s.
Download or print this graphic (200 dpi resolution)
Antibiotic Prescribing

Seven Ways Dentists Can Act Against Antibiotic Resistance
Target Audience: Dental providers
Download or print this Infographic [1 page] (8 ½ by 11)
Infographic Details
Seven Ways Dentists can Act against Antibiotic Resistance
Dental providers are uniquely positioned to play a role in preventing the spread of antibiotic resistance. Here are seven simple “how tos” for safe, appropriate antibiotic prescribing and use when treating dental infections.
- MAKE an accurate diagnosis
- When prescribing an antibiotic, CHOOSE the right drug for the right dose and duration.
- USE narrow-spectrum antibiotics for simple infections and preserve broad-spectrum drugs for more complex infections.
- AVOID prescribing antibiotics for viral infections.
- For empiric treatment, REVISE treatment regimen based on patient progress and/or test results.
- KNOW the side effects and drug interactions of an antibiotic before prescribing.
- TEACH your patients about appropriate antibiotic use and emphasize the importance of taking antibiotics exactly as directed.
Centers for Disease Control and Prevention
National Center for Emerging and Zoonotic Infectious Diseases
To learn more: https://www.cdc.gov/getsmart/community/materials-references/print-materials/hcp/

Improve Antibiotic Use to Combat Antibiotic Resistance
Target Audience: General public and healthcare professionals
Download or print this Infographic [1 page] (8 ½ by 11)

Antibiotic Prescribing Rates Map
Target Audience: General public
This map of the United States shows the states that had the highest and lowest antibiotic prescribing rates in 2013–14.
Download or print this graphic (8 ½ by 11)

A Decade's Difference: Doctor Visits Resulting in Antibiotic Prescription
Target Audience: General public
This graphic shows how the number of doctor visits that resulted in an antibiotic prescription decreased between 1995 and 2006 for the following types of infections: ear infections, colds, bronchitis, sore throats, and sinusitis.
Download or print this graphic (8 ½ by 11)

Antibiotics Prescribed for Acute Respiratory Infections in Kids Younger than 15 Years of Age
Target Audience: General public
This graphic shows how antibiotic prescribing decreased between 1993 and 2008 for children under the age of 15 diagnosed with acute respiratory infections, yet more than half of all antibiotics prescribed in 2007–08 were still for these infections that do not require antibiotic treatment.
Download or print this graphic (8 ½ by 11)

Improving Antibiotic Prescribing
Target Audience: Healthcare professionals
This infographic explains three ways healthcare professionals can improve antibiotic prescribing: staying up to date on clinical guidelines, communicating with patients regarding expectations, and counseling patients about antibiotic resistance.
Download or print this graphic (8 ½ by 11)

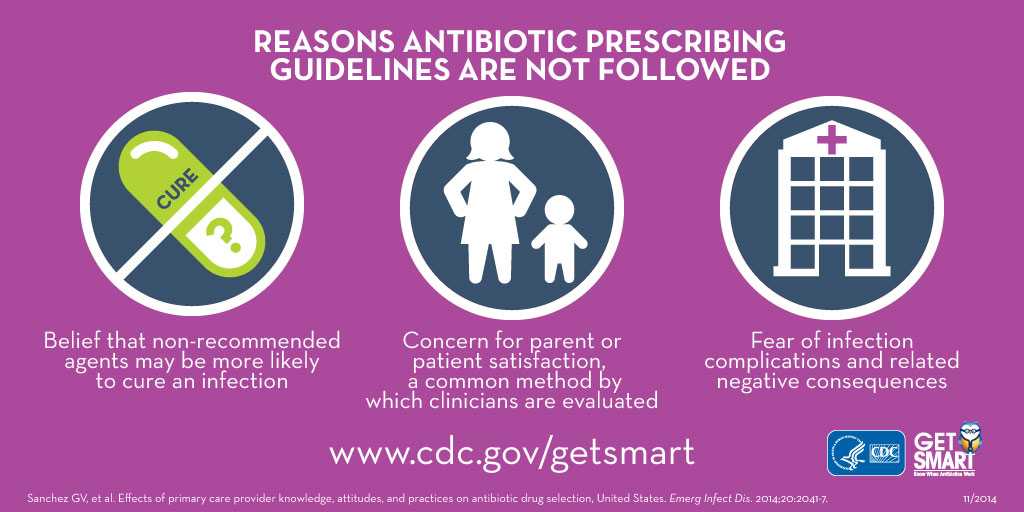
Reasons Antibiotic Prescribing Guidelines Are Not Followed
Target Audience: General public and healthcare professionals
This infographic outlines three reasons antibiotic prescribing guidelines are not followed: belief that non-recommended antibiotics are a better option, concern for patient satisfaction, and fear of infection complications.
Download or print this graphic (8 ½ by 11)
Antibiotic Resistance

How Antibiotic Resistance Happens
Target Audience: General public
This graphic shows the step-by-step process of how antibiotic resistant bacteria develop.
Download or print this graphic (8 ½ by 11)

Annual Burden of Antibiotic Resistance in the United States
Target Audience: General public
This image shows the estimated number of illnesses and deaths caused annually by antibiotic resistance.
Download or print this graphic (8 ½ by 11)
Antibiotic Use

Common Conditions — What’s Got You Sick?
Target Audience: General public
Antibiotics are not effective against viral infections like the common cold, flu, most sore throats, bronchitis, and many sinus and ear infections. Learn when antibiotics are and aren’t needed.
Printer friendly version in color [1 page] (8 ½ by 11)

Understanding Inappropriate Antibiotic Use
Target Audience: General public
This infographic explains the types of inappropriate antibiotic use. The graphic shows an example of unnecessary use or overuse and an example of misuse or incorrect prescription.
Download or print this graphic (8 ½ by 11)

6 Smart Facts About Antibiotic Use
Target Audience: General public
This infographic reviews six facts about antibiotic use: antibiotics are life-saving, antibiotics only treat bacterial infections, not all ear infections and sore throats require antibiotics, green colored mucus is not a sign of a bacterial infection and that taking antibiotics does have risks.
Download or print this graphic (8 ½ by 11)

Outpatient Antibiotic Use: U.S.A. Compared to Europe
Target Audience: General public
This image shows how the United States compares to Europe and many European countries when it comes to outpatient antibiotic use.
Download or print this graphic (8 ½ by 11)
- Page last reviewed: February 8, 2017
- Page last updated: March 29, 2017
- Content source: