

2016 Preliminary Data: Tables and Figures
 ShareCompartir
Where did all the tables go?
You may have noticed FoodNet has published fewer tables in conjunction with the MMWR report this year than in the past. That’s because you can get all of that information and even more with CDC’s new interactive program FoodNet Fast.
Explore FoodNet Fast now—or get more information to help you get started.
Each year, FoodNet publishes a summary of surveillance data and trend information in CDC’s Morbidity and Mortality Weekly Report (MMWR). This year’s report summarizes 2016 preliminary surveillance data and describes trends since 2013 for infections caused by Campylobacter, Cryptosporidium, Cyclospora, Listeria, Salmonella, Shiga toxin-producing Escherichia coli (STEC) O157 and non-O157, Shigella, Vibrio, and Yersinia. This report also includes infections diagnosed by culture-independent diagnostic tests (CIDTs) and contains preliminary data for 2015 on postdiarrheal hemolytic uremic syndrome.
Incidence trends
FoodNet uses a main-effects, log-linear Poisson regression (negative binomial) model to estimate changes in the incidence of infection.
More Information about model
FoodNet uses a main-effects, log-linear Poisson regression (negative binomial) model to estimate changes in the incidence of infection. The model adjusts for the increase in the number of FoodNet sites since 1996 and for variation in the incidence of infections among sites. The average annual incidence for 2006–2008 and 2013–2015 are used for comparisons. The model is used to calculate the estimated change in incidence (relative rate) between 2016 and the comparison periods, with 95% confidence intervals (CI). In the figures that report percentage change, the percentage change for the current year is calculated by comparison with the appropriate comparison period and graphed along with the 95% confidence interval. In the figures that report relative rate, the relative rate for each year is graphed. For STEC non-O157, only change since 2013–2015 was assessed because diagnostic practices changed before then; for Cyclospora, change was not assessed because data were sparse.
By pathogen
Figure 1. Percentage change in incidence of confirmed infections, compared with 2006–2008
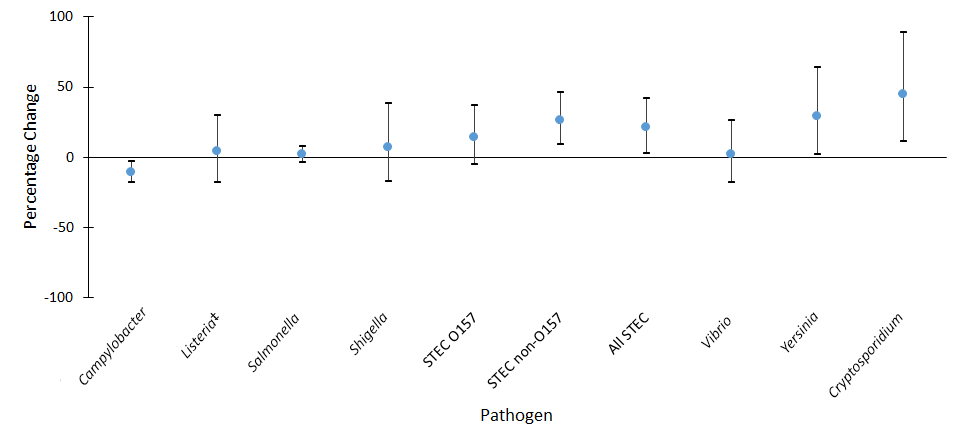
Figure 1. Percentage change in incidence* of culture-confirmed bacterial and parasitic infections in 2016† compared with 2006-2008 average annual incidence, by pathogen, FoodNet
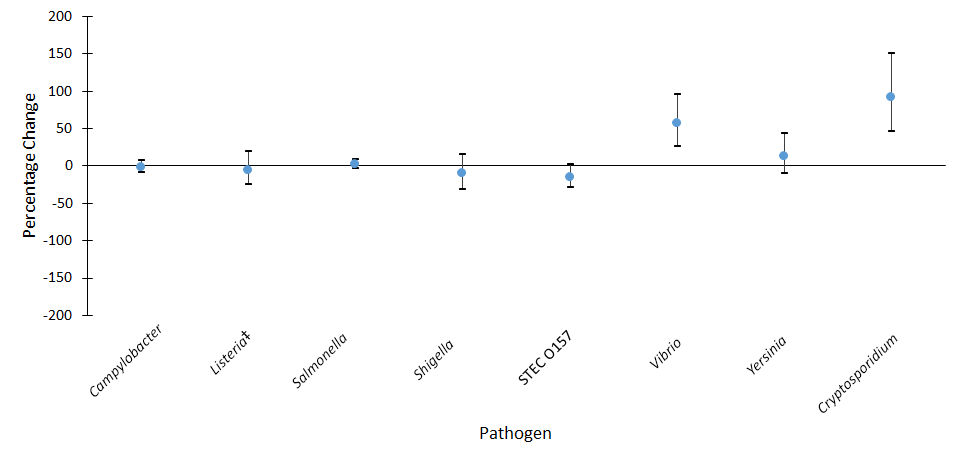
Abbreviations: STEC=Shiga toxin-producing Escherichia coli.
*Estimates and confidence intervals indicate the relative change in incidence of that pathogen compared with 2006–2008. Actual incidences of these infections cannot be determined from the graph. No significant change=95% confidence interval is both above and below the no change line; significant increase=estimate and entire 95% confidence interval are above the no change line; significant decrease=estimate and entire 95% confidence interval are below the no change line.
†Data for 2016 are preliminary.
‡Listeria cases defined as isolation of L. monocytogenes from a normally sterile site or, in the setting of miscarriage or stillbirth, isolate of L. monocytogenes from placental or fetal tissue.
Figure 2. Percentage change in incidence of confirmed or CIDT-positive infections, compared with 2006–2008
Figure 2. Percentage change in incidence* of confirmed or CIDT-positive† bacterial infections in 2016‡ compared with 2006–2008 average annual incidence, by pathogen§, FoodNet
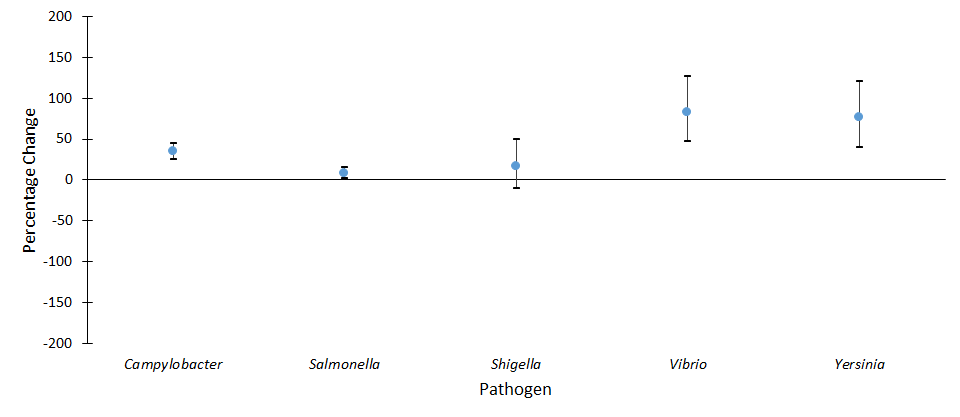
Abbreviations: CIDT=Culture-independent diagnostic test.
*Estimates and confidence intervals indicate the relative change in incidence of that pathogen compared with 2006–2008. Actual incidences of these infections cannot be determined from the graph. No significant change=95% confidence interval is both above and below the no change line; significant increase=estimate and entire 95% confidence interval are above the no change line; significant decrease=estimate and entire 95% confidence interval are below the no change line.
†CIDT-positive is defined as detection of the enteric pathogen in a stool specimen using a culture-independent diagnostic test. Any positive CIDT result that was confirmed by culture is counted only among confirmed infections.
‡Data for 2016 are preliminary.
§Percentage change for confirmed or CIDT-positive infections was not assessed for Listeria because all infections were confirmed; for STEC because only STEC O157 were reported in the comparison period and STEC serogroups cannot be determined among CIDT-positive infections.
Figure 3. Relative rates of confirmed infections by pathogen, compared with 2006–2008
Figure 3. Relative rates* of confirmed infections with Campylobacter, STEC O157, Listeria†, and Salmonella compared with 2006–2008 average annual incidence, by year, FoodNet, 2006–2016‡
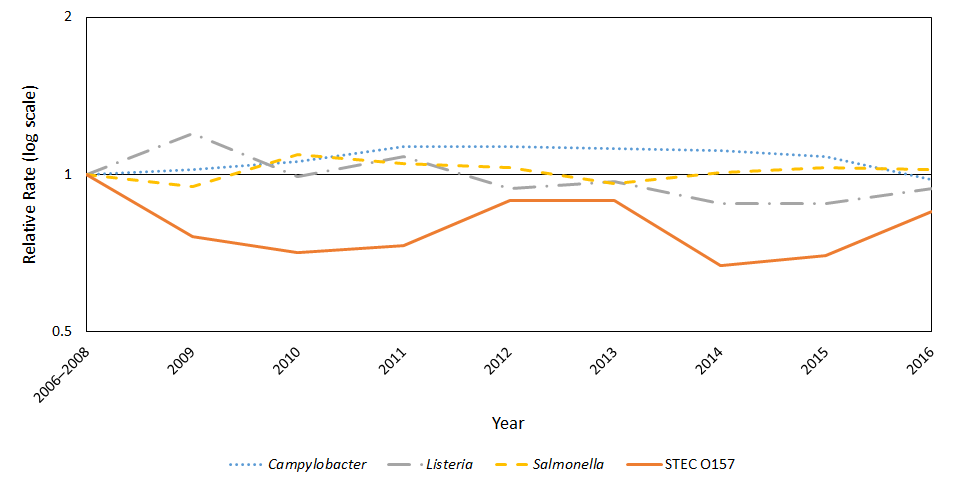
Abbreviations: STEC=Shiga toxin-producing Escherichia coli.
*The position of each line indicates the relative change in incidence of that pathogen compared with 2006–2008. Actual incidence of these infections cannot be determined from this graph.
†Listeria cases defined as isolation of L. monocytogenes from a normally sterile site or, in the setting of miscarriage or stillbirth, isolate of L. monocytogenes from placental or fetal tissue.
‡Data for 2016 are preliminary.
Figure 4. Relative rates of confirmed infections by pathogen, compared with 2006–2008
Figure 4. Relative rates* of confirmed infections with Cryptosporidium, Shigella, Vibrio, and Yersinia compared with 2006–2008 average annual incidence, by year, FoodNet, 2006–2016†
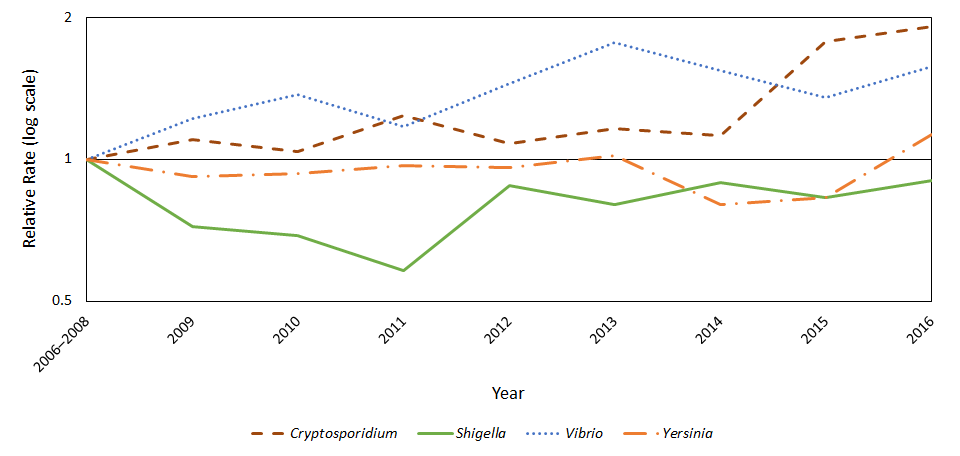
*The position of each line indicates the relative change in incidence of that pathogen compared with 2006–2008. Actual incidence of these infections cannot be determined from this graph.
†Data for 2016 are preliminary.
Figure 5. Relative rates of confirmed or CIDT-positive infections, compared with 2006–2008
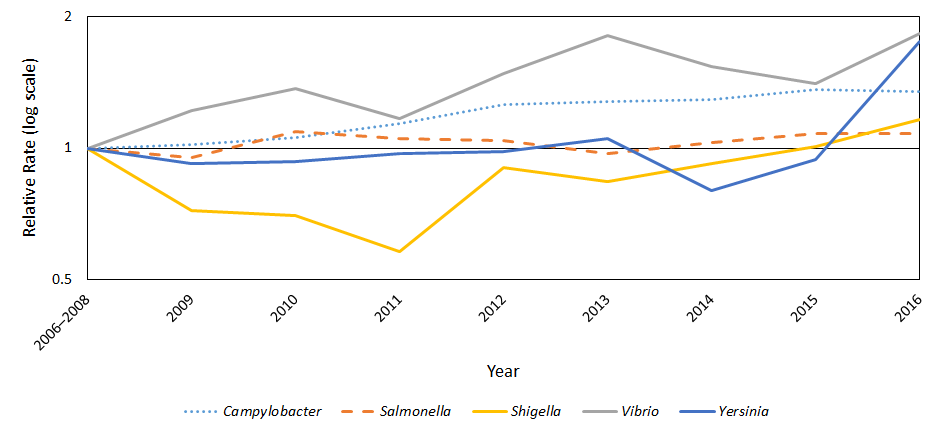
Figure 5. Relative rates* of confirmed or CIDT-positive† bacterial infections with Campylobacter, Salmonella, Shigella, Vibrio, and Yersinia compared with 2006–2008 average annual incidence, by year, FoodNet, 2006–2016‡
Abbreviations: CIDT=Culture-independent diagnostic test.
*The position of each line indicates the relative change in incidence of that pathogen compared with 2006–2008. Actual incidence of these infections cannot be determined from this graph.
†CIDT-positive is defined as detection of the enteric pathogen in a stool specimen using a culture-independent diagnostic test. Any positive CIDT result that was confirmed by culture is counted only among confirmed infections.
‡Data for 2016 are preliminary.
Figure 6. Percentage change in incidence of confirmed infections, compared with 2013–2015
Figure 6. Percentage change in incidence* of confirmed bacterial and parasitic infections in 2016† compared with 2013–2015 average annual incidence, by pathogen, FoodNet
Abbreviations: STEC=Shiga toxin-producing Escherichia coli.
*Estimates and confidence intervals indicate the relative change in incidence of that pathogen compared with 2006–2008. Actual incidences of these infections cannot be determined from the graph. No significant change = 95% confidence interval is both above and below the no change line; significant increase = estimate and entire 95% confidence interval are above the no change line; significant decrease = estimate and entire 95% confidence interval are below the no change line.
†Data for 2016 are preliminary.
‡Listeria cases defined as isolation of L. monocytogenes from a normally sterile site or, in the setting of miscarriage or stillbirth, L. monocytogenes from placental or fetal tissue.
Figure 7. Percentage change in incidence of confirmed or CIDT-positive bacterial infections, compared with 2013–2015
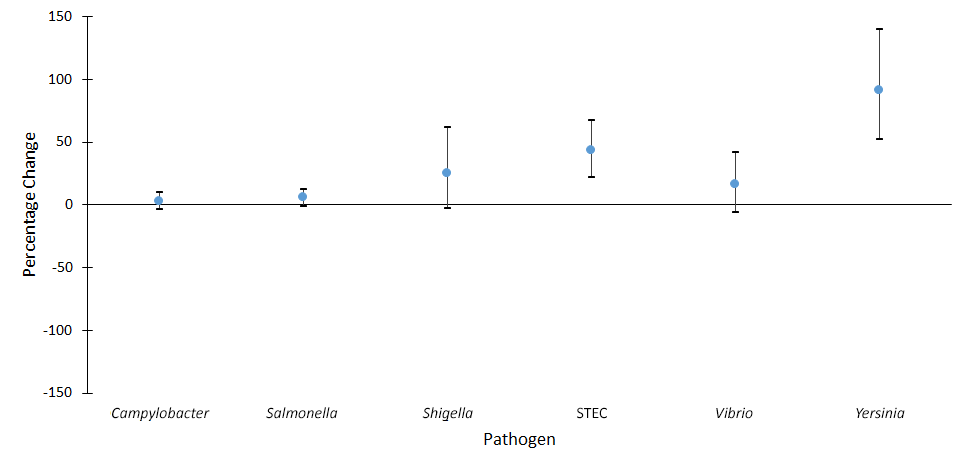
Figure 7. Percentage change in incidence* of confirmed or CIDT-positive† bacterial infections in 2016‡ compared with 2013–2015 average annual incidence, by pathogen§, FoodNet
Abbreviations: CIDT=Culture-independent diagnostic test; STEC=Shiga toxin-producing Escherichia coli.
*Estimates and confidence intervals indicate the relative change in incidence of that pathogen compared with 2006–2008. Actual incidences of these infections cannot be determined from the graph. No significant change=95% confidence interval is both above and below the no change line; significant increase=estimate and entire 95% confidence interval are above the no change line; significant decrease=estimate and entire 95% confidence interval are below the no change line.
†CIDT-positive is defined as detection of the enteric pathogen, or for STEC, Shiga toxin or the genes that encode a Shiga toxin, in a stool specimen or enrichment broth using a culture-independent diagnostic test. Any positive CIDT result that was confirmed by culture is counted only among confirmed infections.
‡Data for 2016 are preliminary
§Percentage change for confirmed or CIDT-positive infections was not assessed for Listeria because all infections were confirmed. All STEC serogroups were combined because it is not possible to distinguish between serogroups based only a CIDT test for Shiga toxin.
Table 1. Summary percentage change in incidence, compared with 2006–2008
Table 1. Percentage change in incidence of confirmed or CIDT-positive* bacterial, confirmed parasitic, and hemolytic uremic syndrome (HUS) in 2016† compared with 2006–2008 average annual incidence, by pathogen, FoodNet
| Confirmed | Confirmed or CIDT-Positive | |||
|---|---|---|---|---|
| Pathogen | % Change‡ | (95% CI) | % Change‡ | (95% CI) |
| Campylobacter | 2%↓ | (9%↓ – 7%↑) | 35%↑ | (25%↑ – 45%↑) |
| Listeria§ | 6%↓ | (25%↓ – 19%↑) | N/A | N/A |
| Salmonella | 2%↓ | (4%↓ – 8%↑) | 8%↑ | (2%↑ – 15%↑) |
| Shigella | 10%↓ | (31%↓ – 16%↑) | 16%↑ | (10%↓ – 49%↑) |
| STEC O157 | 15%↓ | (29%↓ – 2%↑) | N/A | N/A |
| Vibrio | 57%↑ | (26%↑ – 96%↑) | 83%↑ | (47%↑ – 127%↑) |
| Yersinia | 13%↑ | (10%↓ – 43%↑) | 76%↑ | (40%↑ – 121%↑) |
| Cryptosporidium | 91%↑ | (46%↑ – 150%↑) | N/A | N/A |
| Cyclospora¶ | N/A | N/A | N/A | N/A |
| HUS** | 42%↓ | (60%↓ – 17%↓) | N/A | N/A |
Abbreviations: CIDT=Culture-independent diagnostic test; N/A=not applicable; STEC=Shiga toxin-producing Escherichia coli.
*CIDT-positive is defined as the detection of the enteric pathogen, or for STEC, Shiga toxin or the genes that encode a Shiga toxin, in a stool specimen or enrichment broth using a culture-independent diagnostic test. Any positive CIDT result that was confirmed by culture is counted only among the confirmed infections. For STEC, only positive CIDT reports that were confirmed at the state public health laboratory were counted. Percentage change for confirmed or CIDT-positive infections was not assessed for Listeria because all infections were confirmed; for STEC O157, because it is not possible to distinguish between O157 and non-O157 based only on a CIDT test for Shiga toxin; for Cryptosporidium because all infections were confirmed; for Cyclospora, because changes over time were not evaluated; and for HUS, because all infections were confirmed.
†Data for 2016 are preliminary.
‡Percentage change reported as increase (↑) or decrease (↓).
§Listeria cases defined as isolation of L. monocytogenes from a normally sterile site or, in the setting of miscarriage or stillbirth, isolation of L. monocytogenes from placental or fetal issue.
¶Changes over time were not evaluated.
**Change in incidence of postdiarrheal HUS in children aged <5 years for 2015.
Table 2. Summary percentage change in incidence, compared with 2013–2015
Table 2. Percentage change in incidence of confirmed or CIDT-positive* bacterial, confirmed parasitic, and hemolytic uremic syndrome (HUS) in 2016† compared with 2013–2015 average annual incidence, by pathogen, FoodNet
| Confirmed | Confirmed or CIDT-Positive | |||
|---|---|---|---|---|
| Pathogen | % Change‡ | (95% CI) | % Change‡ | (95% CI) |
| Campylobacter | 11%↓ | (18%↓ – 3%↓) | 3%↑ | (4%↓ – 10%↑) |
| Listeria | 4%↑ | (18%↓ – 30%↑) | N/A | N/A |
| Salmonella | 2%↑ | (4%↓ – 8%↑) | 6%↑ | (1%↓ – 12%↑) |
| Shigella | 7%↑ | (17%↓ – 38%↑) | 25%↑ | (3%↓ – 62%↑) |
| STEC | 21%↑ | (3%↑ – 42%↑) | 43%↑ | (22%↑ – 67%↑) |
| Vibrio | 2%↑ | (18%↓ – 26%↑) | 16%↑ | (6%↓ – 26%↑) |
| Yersinia | 29%↑ | (2%↑ – 64%↑) | 91%↑ | (52%↑ – 140%↑) |
| Cryptosporidium | 45%↑ | (11%↑ – 89%↑) | N/A | N/A |
| Cyclospora | N/A | N/A | N/A | N/A |
| HUS | 15%↓ | (42%↓ – 25%↑) | N/A | N/A |
Abbreviations: CIDT=Culture-independent diagnostic test; N/A=not applicable; STEC=Shiga toxin-producing Escherichia coli; HUS=Hemolytic uremic syndrome.
*CIDT-positive is defined as the detection of the enteric pathogen, or for STEC, Shiga toxin or the genes that encode a Shiga toxin, in a stool specimen or enrichment broth using a culture-independent diagnostic test. Any positive CIDT result that was confirmed by culture is counted only among the confirmed infections. For STEC, only positive CIDT reports that were confirmed at the state public health laboratory were counted. Percentage change for confirmed or CIDT-positive infections was not assessed for Listeria because all infections were confirmed; for STEC O157, because it is not possible to distinguish between O157 and non-O157 based only on a CIDT test for Shiga toxin; for Cryptosporidium because all infections were confirmed; for Cyclospora, because changes over time were not evaluated; and for HUS, because all infections were confirmed.
†Data for 2016 are preliminary.
‡Percentage change reported as increase (↑) or decrease (↓).
§Listeria cases defined as isolation of L. monocytogenes from a normally sterile site or, in the setting of miscarriage or stillbirth, isolation of L. monocytogenes from placental or fetal issue.
¶Changes over time were not evaluated.
**Change in incidence of postdiarrheal HUS in children aged <5 years for 2015 compared with 2012–2014.
By Salmonella serotype
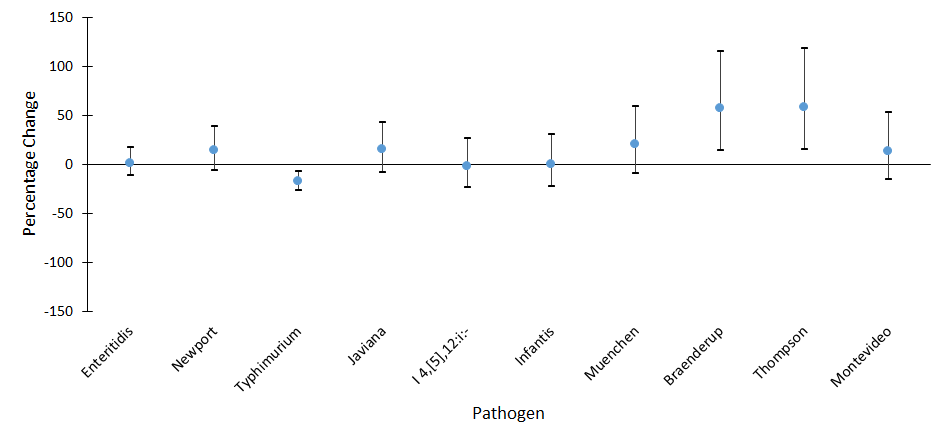
Figure 8. Percentage change in incidence of infections, compared with 2006–2008
Figure 8. Percentage change in incidence* of confirmed Salmonella infections with the top Salmonella serotypes in 2016† compared with 2006–2008 average annual incidence, by serotype, FoodNet
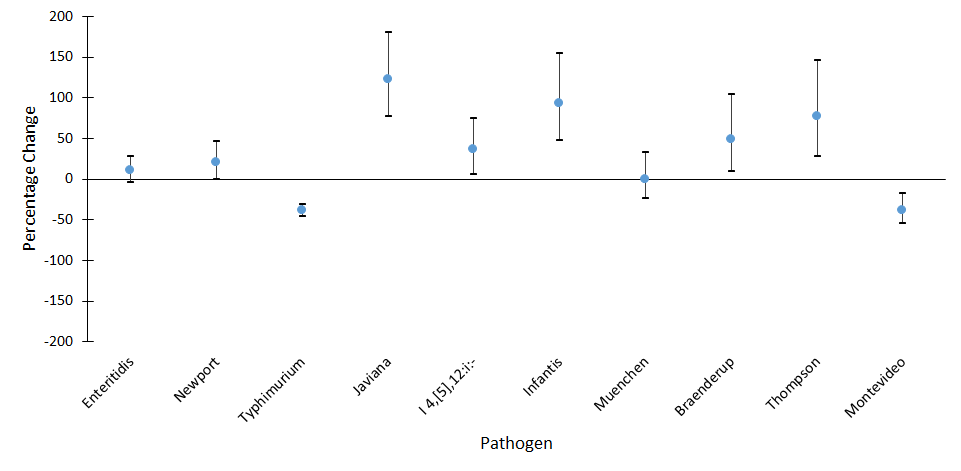
*Estimates and confidence intervals indicate the relative change in incidence of that serotype compared with 2006–2008. Actual incidence of these infections cannot be determined from the graph. No significant change=95% confidence interval is both above and below the no change line; significant increase=estimate and entire 95% confidence interval are above the no change line; significant decrease=estimate and entire 95% confidence interval are below the no change line.
†Data for 2016 are preliminary.
Figure 9. Relative rates of infections, compared with 2006–2008
Figure 9. Relative rates* of confirmed Salmonella infections with the top Salmonella serotypes in 2016 compared with 2006–2008 average annual incidence, by year, FoodNet, 2006–2016†
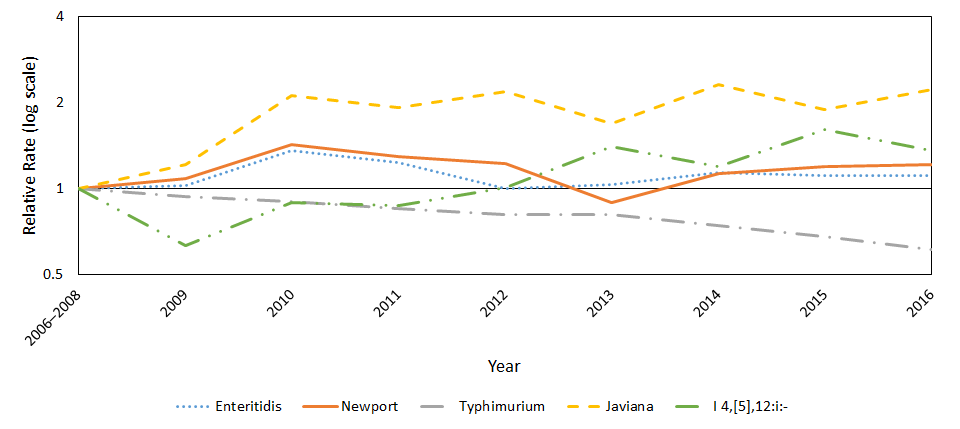
*The position of each line indicates the relative change in incidence of that serotype compared with 2006–2008. Actual incidences of these infections cannot be determined from this graph.
†Data for 2016 are preliminary.
Figure 10. Relative rates of infections, compared with 2006–2008
Figure 10. Relative rates* of confirmed Salmonella infections with the top Salmonella serotypes in 2016 compared with 2006–2008 average annual incidence, by year, FoodNet, 2006–2016†
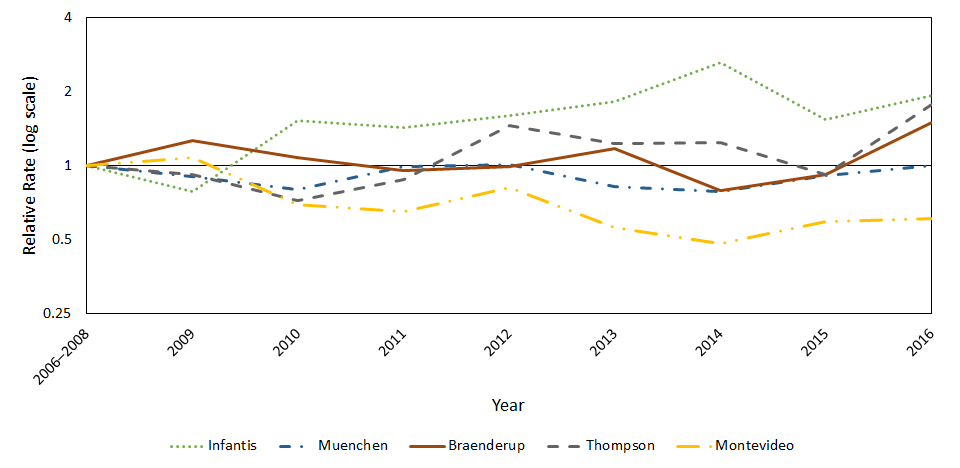
*The position of each line indicates the relative change in incidence of that serotype compared with 2006–2008. Actual incidences of these infections cannot be determined from this graph.
†Data for 2016 are preliminary.
Download the data: Figure 10 – Relative rates of confirmed Salmonella infections with the top Salmonella serotypes in 2016, compared with 2006–2008
Figure 11. Percentage change in incidence of infections, compared with 2013–2015
Figure 11. Percentage change in incidence* of confirmed Salmonella infections with the top Salmonella serotypes in 2016† compared with 2013–2015 average annual incidence, by serotype, FoodNet
*Estimates and confidence intervals indicate the relative change in incidence of that serotype compared with 2006–2008. Actual incidence of these infections cannot be determined from the graph. No significant change=95% confidence interval is both above and below the no change line; significant increase=estimate and entire 95% confidence interval are above the no change line; significant decrease=estimate and entire 95% confidence interval are below the no change line.
†Data for 2016 are preliminary.
Table 3. Summary percentage change in incidence (all comparison periods)
Table 3. Percentage change in incidence of confirmed Salmonella infections with the top 10 Salmonella serotypes in 2016* compared with 2006–2008 and 2013–2015 average annual incidence, by serotype, FoodNet
| 2006–2008 comparison period | 2013–2015 comparison period | ||||
|---|---|---|---|---|---|
| Salmonella serotype | Rank in 2016 | % Change† | (95% CI) | % Change† | (95% CI) |
| Enteritidis | 1 | 11% ↑ | (4%↓ – 28%↑) | 1%↑ | (12%↓ – 17%↑) |
| Newport | 2 | 21%↑ | (0% – 46%↑) | 14%↑ | (6%↓ – 38%↑) |
| Typhimurium | 3 | 39%↓ | (46%↓ – 31%↓) | 18%↓ | (27%↓ – 7%↓) |
| Javiana | 4 | 123%↑ | (77%↑ – 180%↑) | 15%↑ | (8%↓ – 43%↑) |
| I 4,[5],12:i:- | 5 | 36%↑ | (6%↑ – 75%↑) | 2%↓ | (24%↓ – 26%↑) |
| Infantis | 6 | 93%↑ | (47%↑ – 155%↑) | 0% | (23%↓ – 30%↑) |
| Muenchen | 7 | 0% | (24%↓ – 33%↑) | 20%↑ | (10%↓ – 59%↑) |
| Braenderup | 8 | 49%↑ | (9%↑ – 104%↑) | 57%↑ | (14%↑ – 115%↑) |
| Thompson | 9 | 77%↑ | (28%↑ – 146%↑) | 58%↑ | (15%↑ – 118%↑) |
| Montevideo | 10 | 39%↓ | (54%↓ – 18%↓) | 13%↑ | (16%↓ – 53%↑) |
*Data for 2016 are preliminary.
†Percentage change reported as increase (↑) or decrease (↓).
Overall change in incidence
Table 4. Overall change in combined incidence, compared with 2006–2008
Table 4. Overall change in combined incidence of confirmed or CIDT-positive* Campylobacter, Listeria+, Salmonella, STEC, Vibrio, and Yersinia in 2016‡ compared with 2006–2008 average annual incidence, FoodNet
| Confirmed | Confirmed or CIDT-Positive | |||
|---|---|---|---|---|
| Pathogen | % Change§ | (95% CI) | % Change§ | (95% CI) |
| 2016 | 6%↑ | (4%↓ – 17%↑) | 22%↑ | (11%↑ – 35%↑) |
Abbreviations: CIDT=Culture-independent diagnostic test; STEC=Shiga toxin-producing Escherichia coli.
*CIDT-positive is defined as detection of the enteric pathogen, or for STEC, Shiga toxin or the genes that encode a Shiga toxin, in a stool specimen or enrichment broth using a culture-independent diagnostic test. Any positive CIDT result that was confirmed by culture is counted only among the confirmed infections.
†Listeria cases defined as isolation of L. monocytogenes from a normally sterile site or, in the setting of miscarriage or stillbirth, isolation of L. monocytogenes from placental or fetal issue.
‡Data for 2016 are preliminary.
§Overall change reported as increase (↑) or decrease (↓). This measure does not allow for assessment of changes in infections of individual pathogens.
Download the table: Table 4. Overall change in combined incidence of confirmed or CIDT-positive Vibrio, and Yersinia in 2016 compared with 2006–2008 average annual incidence, FoodNet [XLS – 9 KB]
Related Links
- Page last reviewed: March 8, 2017
- Page last updated: March 8, 2017
- Content source: