

2015 Preliminary Data: Tables and Figures
 ShareCompartir
Each year, FoodNet publishes a summary of surveillance data and trend information in CDC’s Morbidity and Mortality Weekly Report (MMWR). This page includes information from the report that summarized 2015 preliminary surveillance data and described trends from 2012 through 2015 for infections caused by Campylobacter, Cryptosporidium, Cyclospora, Listeria, Salmonella, Shiga toxin-producing Escherichia coli (STEC) O157 and non-O157, Shigella, Vibrio, and Yersinia. This report also contained preliminary postdiarrheal hemolytic uremic syndrome data for 2014.
Incidence Trends
FoodNet uses a main-effects, log-linear Poisson regression (negative binomial) model to estimate changes in the incidence of infection and to measure overall trends in incidence.
More information on the model
FoodNet uses a main-effects, log-linear Poisson regression (negative binomial) model to estimate changes in the incidence of infection. The model adjusts for the increase in the number of FoodNet sites since 1996 and for variation in the incidence of infections among sites. The average annual incidence for 1) 1996–1998 (1997–1998 for Cryptosporidium), the first years of surveillance, 2) a more recent 3-year period (2006–2008), and 3) the preceding 3 years (2012–2014) are used for comparisons. The model is used to calculate the estimated change in incidence (relative rate) between 2015 and the comparison periods, with 95% confidence intervals (CI). In the figures that report percentage change, the percentage change for the current year is calculated by comparison with the appropriate comparison period and graphed along with the 95% confidence interval. In the figures that report relative rate, the relative rate for each year is graphed. For STEC non-O157, only change since 2012–2014 was assessed because diagnostic practices changed before then; for Cyclospora, change was not assessed because data were sparse.
By pathogen
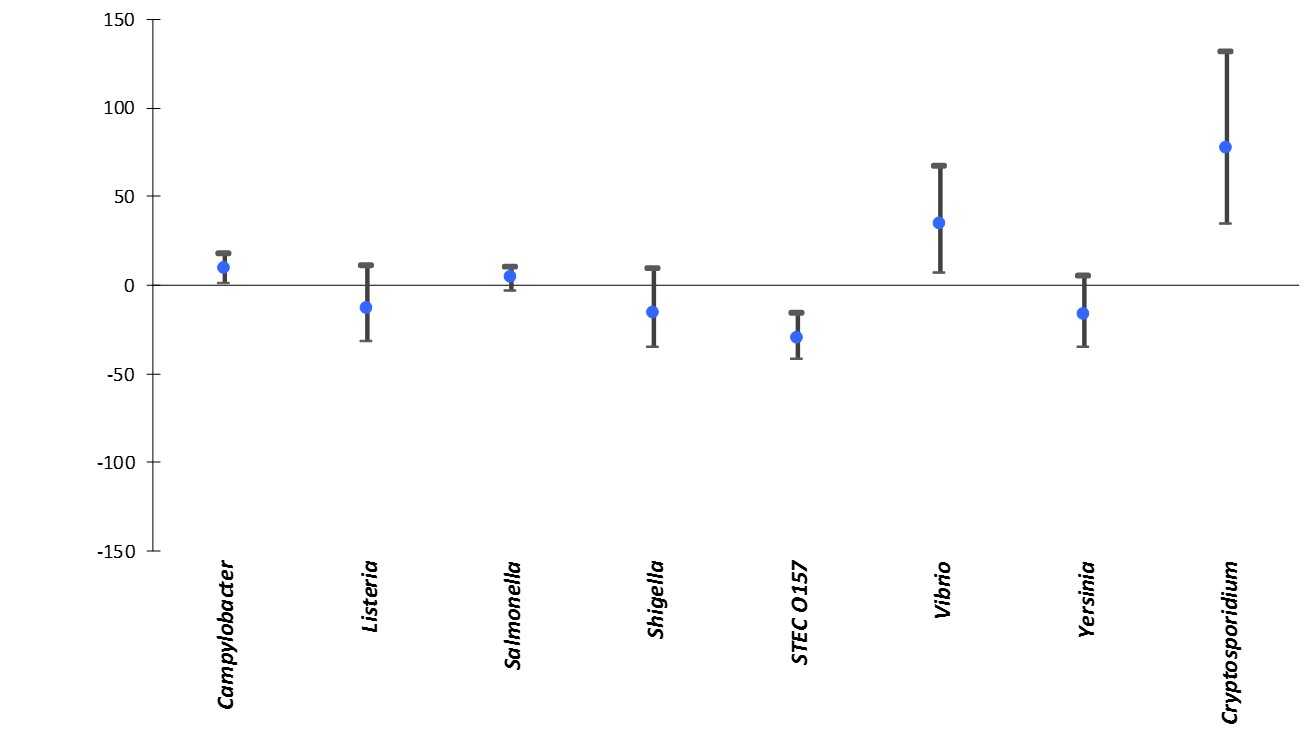
Figure 1. Percentage change in incidence of infection, compared with 2006-2008
Figure 1. Percentage change in incidence* of culture-confirmed bacterial and laboratory-confirmed parasitic infections in 2015† compared with average annual incidence during 2006–2008, by pathogen, FoodNet
Pathogen
*The estimates and confidence intervals presented indicate the relative change in the incidence of that pathogen compared with 2006–2008. The actual incidences of these infections cannot be determined from the graph.
†Data are preliminary
§No significant change = 95% confidence interval is both above and below the no change line; significant increase = estimate and entire 95% confidence interval are above the no change line; significant decrease = estimate and entire 95% confidence interval are below the no change line
¶Shiga toxin-producing Escherichia coli
Figure 2. Relative rates by pathogen, compared with 2006-2008
Figure 2. Relative rates of culture-confirmed infections with Campylobacter, STEC* O157, Listeria, Salmonella, and Vibrio compared with 2006–2008 rates, by year, FoodNet 2006–2015†
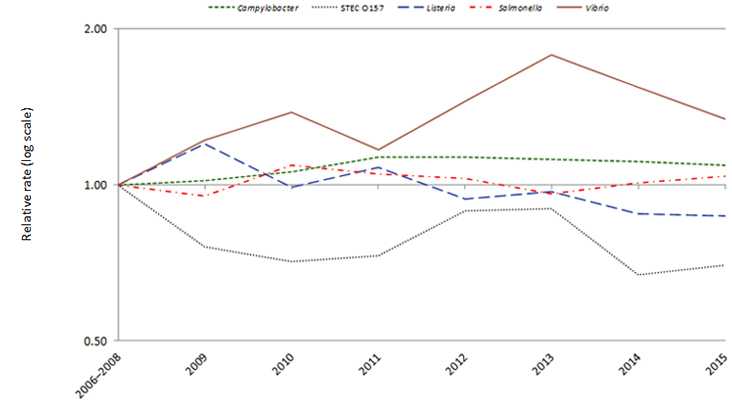
*Shiga toxin-producing Escherichia coli
†The position of each line indicates the relative change in the incidence of that pathogen compared with 2006–2008. The actual incidences of these infections cannot be determined from this graph. Data for 2015 are preliminary.
Figure 3. Relative rates of infections, compared with 2006-2008
Figure 3. Relative rates of culture-confirmed infections with Shigella, Yersinia, and laboratory-confirmed infections with Cryptosporidium compared with 2006–2008 rates, by year, FoodNet 2006–2015*
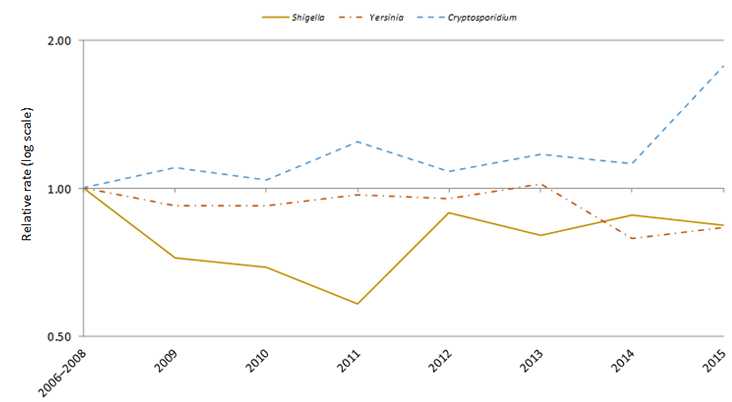
*The position of each line indicates the relative change in the incidence of that pathogen compared with 2006–2008. The actual incidences of these infections cannot be determined from this graph. Data for 2014 are preliminary.
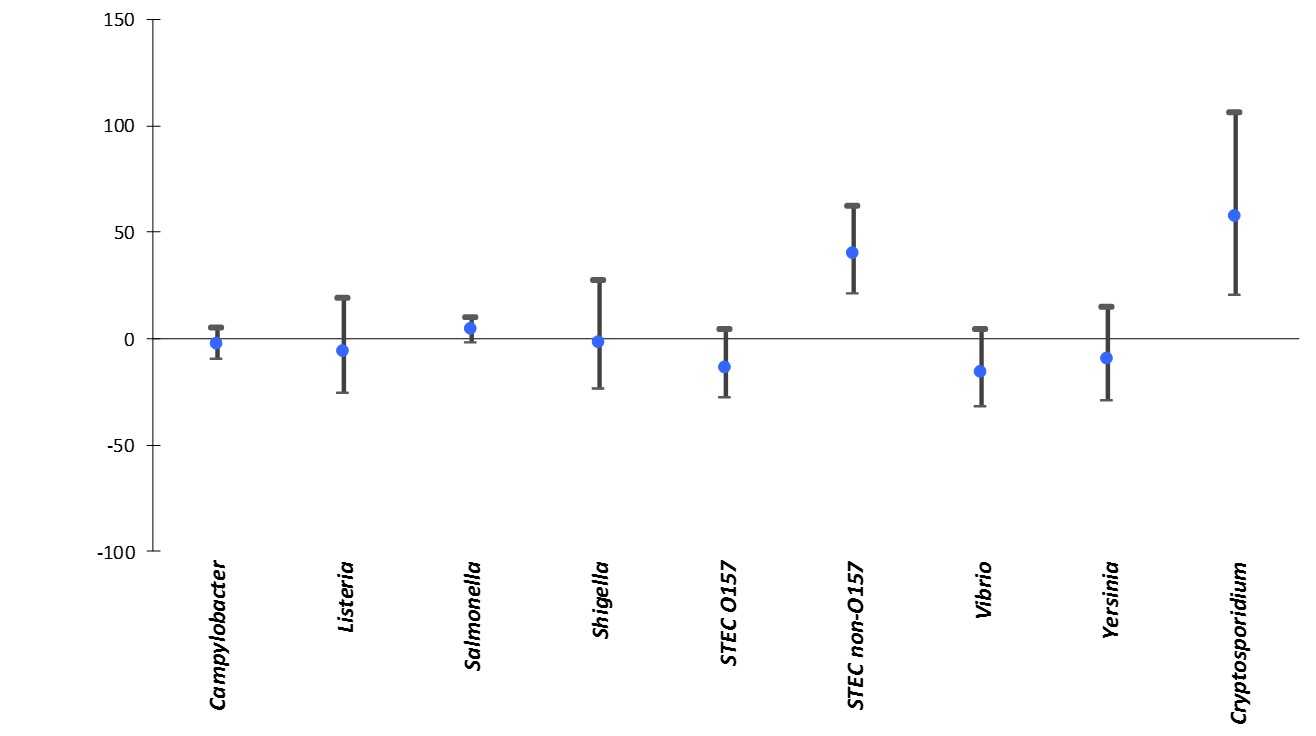
Figure 4. Percentage change in incidence of infection, compared with 2012-2014
Figure 4. Percentage change in incidence* of culture-confirmed bacterial and laboratory-confirmed parasitic infections in 2015† compared with average annual incidence during 2012–2014, by pathogen, FoodNet
Pathogen
*The estimates and confidence intervals presented indicate the relative change in the incidence of that pathogen compared with 2012–2014. The actual incidences of these infections cannot be determined from the graph.
†Data are preliminary
§No significant change = 95% confidence interval is both above and below the no change line; significant increase = estimate and entire 95% confidence interval are above the no change line; significant decrease = estimate and entire 95% confidence interval are below the no change line
¶Shiga toxin-producing Escherichia coli
By Salmonella serotype
Figure 5. Percentage change in incidence of infecition, compared with 2006-2008
Figure 5. Percentage change in incidence* of culture-confirmed Salmonella infections with the top Salmonella serotypes in 2015† compared with average annual incidence during 2006–2008, by serotype, FoodNet
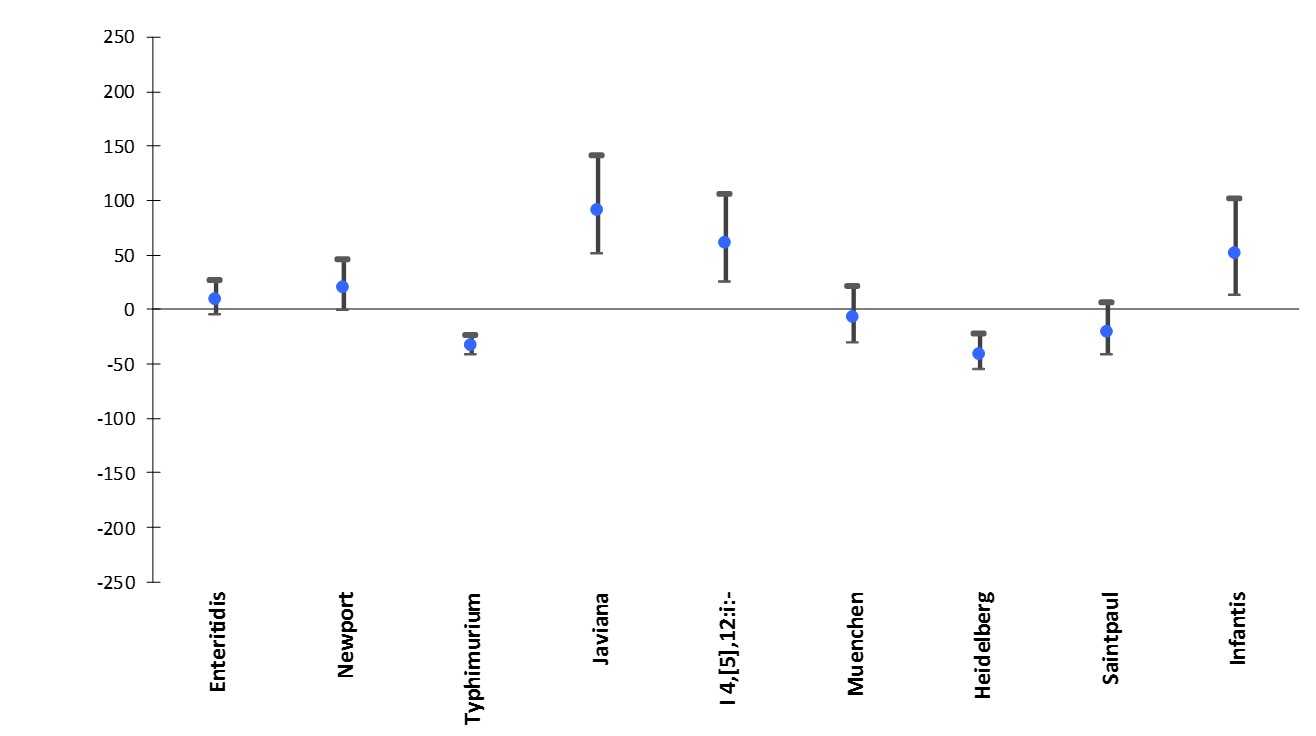
Salmonella serotype
*The estimates and confidence intervals presented indicate the relative change in the incidence of that serotype compared with 2006–2008. The actual incidences of these infections cannot be determined from the graph.
†Data are preliminary. Percentage change was not evaluated for serotype I 13,23:b:-.
§No significant change = 95% confidence interval is both above and below the no change line; significant increase = estimate and entire 95% confidence interval are above the no change line; significant decrease = estimate and entire 95% confidence interval are below the no change line
Figure 6. Relative rate of infection, compared with 2006-2008
Figure 5. Percentage change in incidence* of culture-confirmed Salmonella infections with the top Salmonella serotypes in 2015† compared with average annual incidence during 2006–2008, by serotype, FoodNet
Salmonella serotype
*The estimates and confidence intervals presented indicate the relative change in the incidence of that serotype compared with 2006–2008. The actual incidences of these infections cannot be determined from the graph.
†Data are preliminary. Percentage change was not evaluated for serotype I 13,23:b:-.
§No significant change = 95% confidence interval is both above and below the no change line; significant increase = estimate and entire 95% confidence interval are above the no change line; significant decrease = estimate and entire 95% confidence interval are below the no change line
Figure 7. Relative rate of infection, compared with 2006-2008
Figure 7. Relative rates of culture-confirmed Salmonella infections with the top Salmonella serotypes in 2015* compared with 2006–2008 rates, by year, FoodNet 2006–2015†
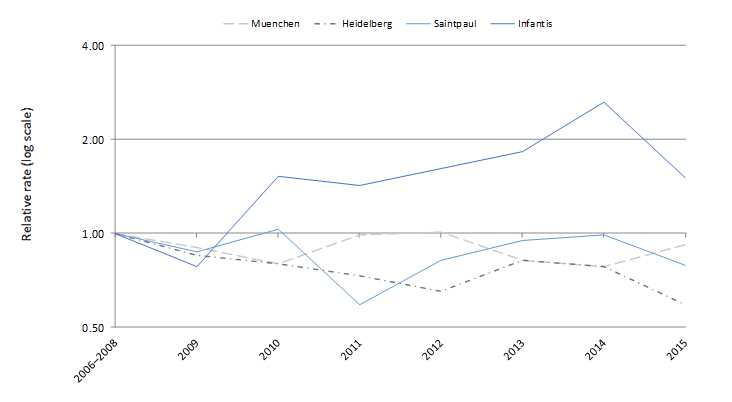
*Data for 2015 are preliminary. Salmonella serotypes included are: Muenchen, Heidelberg, Saintpaul, and Infantis. Percentage change was not evaluated for serotype Poona.
The position of each line indicates the relative change in the incidence of that serotype compared with 2006-2008. The actual incidences of these infections cannot be determined from this graph.
Figure 8. Percentage change in incidence of infection, compared with 2012-2014
Figure 8. Percentage change in incidence* of culture-confirmed Salmonella infections with the top Salmonella serotypes in 2015† compared with average annual incidence during 2012–2014, by serotype, FoodNet
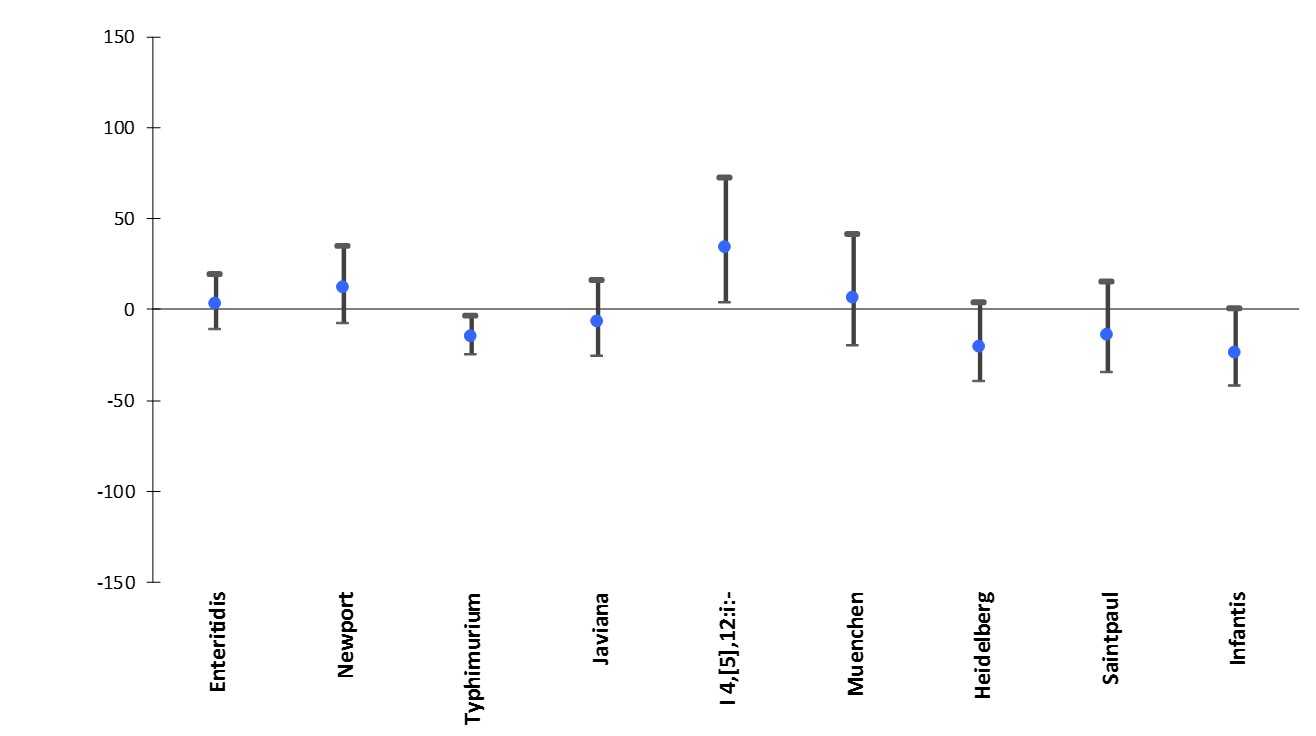
Salmonella serotype
*The estimates and confidence intervals presented indicate the relative change in the incidence of that serotype compared with 2012–2014. The actual incidences of these infections cannot be determined from the graph.
†Data are preliminary. Percentage change was not evaluated for serotype Poona.
§No significant change = 95% confidence interval is both above and below the no change line; significant increase = estimate and entire 95% confidence interval are above the no change line; significant decrease = estimate and entire 95% confidence interval are below the no change line
- Page last reviewed: March 3, 2016
- Page last updated: March 3, 2016
- Content source: