

How to Make a Map of Health Care Costs
 ShareCompartir
Step 1
Select the Map Area. Maps can be viewed in three ways, depending on your geographic area of interest:
- A map of the entire United States with state-level data (US Map—State Level).
- A map of the entire United States with county-level data (US Map—County Level).
- A map of a single state with county-level data.

Step 2
Choose your topic of interest and expand that section in the left navigation bar. Data are available at the following geographies.
| Geography | |||
|---|---|---|---|
| Topic | State | County | Census Tract |
| Health Care Costs | X | ||
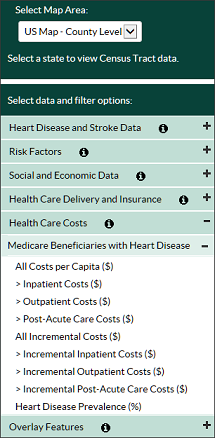
Step 3
Expand the selection and choose the topic to display.
Frequently Asked Questions
What is the data source used?
The data used are from the Centers for Medicare and Medicaid Services’ (CMS) Chronic Conditions Data Warehouse.
Who was the population studied?
We limited the analyses to only Medicare Fee-for-service beneficiaries with both Medicare Part A and Part B coverage and who were aged 65 years or older. We excluded beneficiaries enrolled in Medicare Advantage or in Medicare Part A only or Part B only. Maps are based on beneficiary-years, or the number of years that people were covered by Medicare Fee-for-service health insurance coverage.
How were beneficiaries with diagnosed heart disease defined?
Beneficiaries with diagnosed heart disease were identified using the following CMS Hierarchical Condition Category codes: congestive heart failure (80), acute myocardial infarction (81), unstable angina/acute ischemic heart disease (82), and specified heart arrhythmias (92).
What is the suppression criteria used?
Data for counties with small populations are not displayed. County-level health care costs were suppressed when counties had <20 beneficiaries.
What are age adjusted costs?
All cost data have been directly age-standardized using the 2000 US Standard Population. An age- standardized rate is a weighted average of age specific rates calculated on the basis of the proportion of people in the corresponding age groups of a standard population. Age adjustment allows for comparison of rates between counties with different age distributions.
What are standardized costs?
To make Medicare payments across geographic areas comparable, payments have been standardized to remove geographic differences in payment rates for individual services, such as those that account for local wages or input prices.
What type of costs are presented?
Costs of care per capita and Incremental costs of care per capita for Medicare beneficiaries with diagnosed Heart Disease are provided. Costs per capita are the average costs incurred by a Medicare beneficiary with diagnosed heart disease in a given county. Incremental costs are the costs incurred among beneficiaries with diagnosed heart disease above and beyond the costs incurred among beneficiaries without diagnosed heart disease.
Costs include Medicare, beneficiary, and third-party payments and are presented for the following service categories: inpatient, outpatient, post-acute care, and total costs (total costs include inpatient, outpatient, post-acute care (e.g. skilled nursing facility care and home health), hospice, physician, testing, and imaging costs).
What are incremental costs?
Incremental costs are calculated by taking the difference between mean annual costs per capita for beneficiaries with and without diagnosed heart disease for each county. They are the costs incurred among beneficiaries with diagnosed heart disease above and beyond the costs incurred among beneficiaries without heart disease. This can also be thought of as the “excess” cost attributed to having the condition. In 2015, Medicare beneficiaries with heart disease had, on average, over $10,000 more in healthcare costs compared to those without heart disease.
More information on incremental costs are available here:
Wakim R, Ritchey M, Hockenberry J, Casper M. Geographic Variations in Incremental Costs of Heart Disease Among Medicare Beneficiaries, by Type of Service, 2012. Preventing Chronic Disease. 2016;13:E180. doi:10.5888/pcd13.160209. https://www.cdc.gov/pcd/issues/2016/16_0209.htm
Recommended Citation for Maps
This map was created using the Interactive Atlas of Heart Disease and Stroke, a website developed by the Centers for Disease Control and Prevention, Division for Heart Disease and Stroke Prevention. http://nccd.cdc.gov/DHDSPAtlas.
- Page last reviewed: July 19, 2017
- Page last updated: July 19, 2017
- Content source: