

Map Tools
 ShareCompartir
Get tips to use when creating maps, comparing data, and printing or saving maps and data for reports and presentations.

|
Compare Layers
Compare social and economic data or health services with heart disease and stroke data. There is a divider between the two maps that can be moved side-to-side to explore both variables. Select data to display a map of heart disease or stroke data first, then select “Compare Layers” in the tool bar to add data for comparison. Close dialog window or select “Compare Layers” again to close the tool. |

|
Toggle Second Map
Compare two maps side by side. This tool can be used to compare two health, social, or economic indicators. The blue outline on the map window indicates which map is active. The left navigation menu will make changes to the active map. Click in the second map window to make that map active. Select “Close Second Map” in the tool bar to close the second window. |

|
Maps over Time
Play an animation of heart disease or stroke data over time for years available. You can change the speed of playback by selecting from the drop-down menu, advance or reverse, and pause. |

|
PDF/IMG
Print a map or save the map as an image for use in a document or publication. Select layout type (Portrait or Landscape) from the drop-down menu, then choose the output file type (PDF, PNG, JPG, or SVG). Select “Generate Preview,” and then select “Print” to open or save the file. Please use the suggested citation for any maps used. |

|
Report/Export
Create and export reports to view data associated with a specific county, state, or selection of counties or states. Reports display information for the chosen health indicator. Reports for individual counties also display demographic, social, and economic data. Generate reports by selecting the Report/Export tool and either searching for a state or county by name or using the selection method. Select a group of counties using a selection box, shape, or point. Counties may be removed from the selected set with the subtract point tool. To select all available geographies, click “Next.” Additional social and economic or health services data can be included in the report/export. Select “Generate Report” to create a printable report page(s), or select “Export Data” to save the data as a spreadsheet. Generate state and county reports by selecting the county or state and clicking the link to view the report from the popup window. |

|
Download GIS Data
Export the displayed dataset in either a shapefile or file geodatabase format. The file will be downloaded as a .zip file. Note: Data values within the table of “-1” indicate “Insufficient Data.” Visit How to Download the Data to view step-by-step instructions. |

|
Create Link
Create a link to the current map so the map view can be shared with others. |

|
Reset Maps
Select to clear the map selections. |

|
Help
Get help on how to use the map and data. |

|
Feedback
Provide feedback with or without your contact information. |

|
Search Bar
Enter a county or city name to zoom to that location on the map. Click the magnifying glass to search. |

|
Undo
Click undo to reverse previous action. |

|
Histogram
View a histogram to display the distribution of the data currently displayed on the map. |

|
Legend
Turn legend on and off. The legend displays the symbols, colors, and data categories of the current map. |

|
Popups
When active, a pop-up box displaying information for a feature (e.g., county) will automatically appear when you hover over the feature. |

|
Data Sources
View a list of the data sources displayed in the current map. |

|
Hot Spot Analysis
Available when a single state map is displayed. Click on the tool on the left of the map window to calculate and identify clusters of high or low values. For more information, see Statistical Methods. To compare the calculated clusters with the original data, run the Hotspot Analysis, and then use the Compare Layers tool. Select “Cluster Analysis” in the drop-down menu. |
|
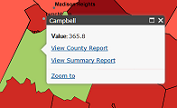
Viewing Reports
To view a report for one county that displays additional demographic, social, and economic data, click on a county and select “View County Report.” To view additional tables with national and state comparison data, click on a county and select “View Summary Report.” |
- Page last reviewed: July 19, 2017
- Page last updated: July 19, 2017
- Content source: