

Teen Drivers: Get the Facts
 ShareCompartir
Motor vehicle crashes are the leading cause of death for U.S. teens.1 Fortunately, teen motor vehicle crashes are preventable, and proven strategies can improve the safety of young drivers on the road.
How big is the problem?
In 2015, 2,333 teens in the United States ages 16–19 were killed and 221,313 were treated in emergency departments for injuries suffered in motor vehicle crashes in 2014.1 That means that six teens ages 16–19 died every day from motor vehicle injuries.
In 2013, young people ages 15-19 represented only 7% of the U.S. population. However, they accounted for 11% ($10 billion) of the total costs of motor vehicle injuries.1
Who is most at risk?
The risk of motor vehicle crashes is higher among 16-19-year-olds than among any other age group. In fact, per mile driven, teen drivers ages 16 to 19 are nearly three times more likely than drivers aged 20 and older to be in a fatal crash.2
Among teen drivers, those at especially high risk for motor vehicle crashes are:
- Males: In 2014, the motor vehicle death rate for male drivers and passengers ages 16 to 19 was two times that of their female counterparts.1
- Teens driving with teen passengers: The presence of teen passengers increases the crash risk of unsupervised teen drivers. This risk increases with the number of teen passengers.3,4
- Newly licensed teens: Crash risk is particularly high during the first months of licensure.5,6 The crash rate per mile driven is 3 times higher for 16-17 year olds as compared to 18-19 year olds. 2
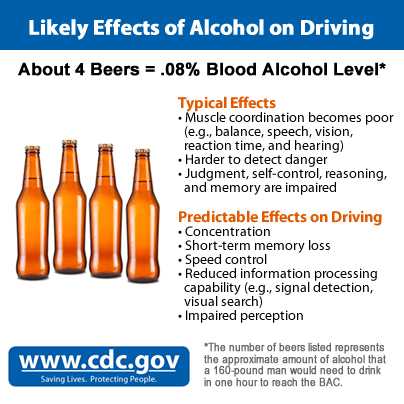
Learn more about the effects of blood alcohol concentration.
What factors put teen drivers at risk?
- Teens are more likely than older drivers to underestimate dangerous situations or not be able to recognize hazardous situations.7 Teens are also more likely than adults to make critical decision errors that lead to serious crashes.8
- Teens are more likely than older drivers to speed and allow shorter headways (the distance from the front of one vehicle to the front of the next). The presence of male teenage passengers increases the likelihood of this risky driving behavior.9
- In 2014, 50% of teen deaths from motor vehicle crashes occurred between 3 p.m. and midnight and 53% occurred on Friday, Saturday, or Sunday.2
- Compared with other age groups, teens have among the lowest rates of seat belt use. In 2015, only 61% of high school students reported they always wear seat belts when riding with someone else.10
- At all levels of blood alcohol concentration (BAC), the risk of involvement in a motor vehicle crash is greater for teens than for older drivers.11
- Among male drivers between 15 and 20 years of age who were involved in fatal crashes in 2014, 36% were speeding at the time of the crash10 and 24% had been drinking.12
- In 2014, 17% of drivers aged 16 to 20 involved in fatal motor vehicle crashes had a BAC of .08% or higher.13
- In a national survey conducted in 2015, 20% of teens reported that, within the previous month, they had ridden with a driver who had been drinking alcohol. Among students who drove, 8% reported having driven after drinking alcohol within the same one-month period.10
- In 2014, 64% of drivers aged 15 to 20 who were killed in motor vehicle crashes after drinking and driving were not wearing a seat belt.12
How can deaths and injuries resulting from crashes involving teen drivers be prevented?
There are proven methods to helping teens become safer drivers.
Eight Danger Zones
Make sure your young driver is aware of the leading causes of teen crashes:
- Driver inexperience
- Driving with teen passengers
- Nighttime driving
- Not using seat belts
- Distracted driving
- Drowsy driving
- Reckless driving
- Impaired driving
Learn what research has shown parents can do to keep teen drivers safe from each of these risks.
Learn More about the 8 Danger Zones
Seat Belts
Of the teens (aged 16-19) who died in passenger vehicle crashes in 2015 approximately 47% were not wearing a seat belt at the time of the crash.2 Research shows that seat belts reduce serious crash-related injuries and deaths by about half.14
Primary Enforcement of Seat Belt Laws
State seat belt laws vary in enforcement. A primary seat belt law allows police to ticket a driver or passenger exclusively for not wearing a seat belt. A secondary law allows police to ticket motorists for not wearing a seat belt only if the driver has been pulled over for a different violation. Some states that have secondary seat belt laws permit primary enforcement for occupants under the age of 18 years.
This graphic shows the percentage of high school students in the US who always used a seat belt riding as passengers in 2015 by type of seat belt law in 32 states (for which data are currently available).
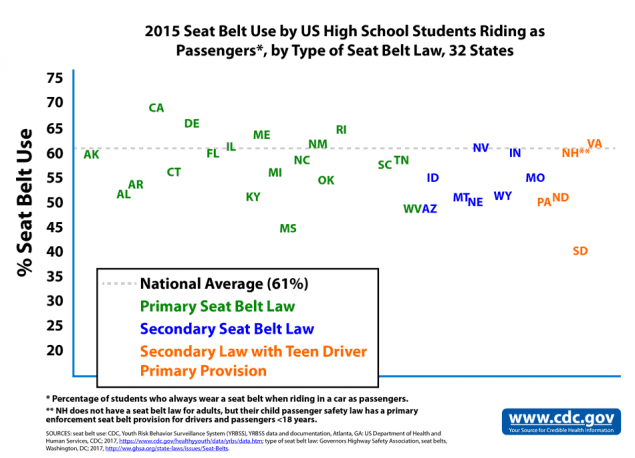
2015 Seat Belt Use by US High School Students Riding as Passengers*, by Type of Seat Belt Law, 32 States
*Percentage of students who always wear a seat belt when riding in a car as passengers.
**NH does not have a seat belt law for adults, but their child passenger safety law has a primary enforcement seat belt provision for drivers and passengers < 18 years.
SOURCES: seat belt use: CDC, Youth Risk Behavior Surveillance System (YRBSS), YRBSS data and documentation, Atlanta, GA: US Department of Health and Human Services, CDC; 2017, https://www.cdc.gov/healthyyouth/data/yrbs/data.htm; type of seat belt law: Governors Highway Safety Association, seat belts, Washington, DC; 2017, http://www.ghsa.org/state-laws/issues/Seat-Belts.
State percentages of seat belt use and type of seat belt law: AK 60% (primary), AL 52% (primary), AR 54% (primary), AZ 49% (secondary), CA 69% (primary), CT 56% (primary), DE 66% (primary), FL 60% (primary), ID 56% (secondary), IL 61% (primary), KY 52% (primary), ME 64% (primary), MI 57% (primary), MO 55% (secondary), MS 45% (primary), MT 51% (secondary), NC 58% (primary), ND 51% (secondary law with teen driver primary provision), NE 50% (secondary), NH 60% (no adult seat belt law but a teen driver primary provision), NM 62% (primary), NV 61% (secondary), OK 55% (primary), PA 50% (secondary law with teen driver primary provision), RI 65% (primary), SC 58% (primary), SD 40% (secondary law with teen driver primary provision), TN 59% (primary), VA 62% (secondary law with teen driver primary provision), WV 49% (primary), WY 51% (secondary), national 61%
Not Drinking & Driving
Enforcing minimum legal drinking age laws and zero blood-alcohol tolerance laws for drivers under age 21 are recommended.
Graduated Driver Licensing Programs (GDL)
Driving is a complex skill, one that must be practiced to be learned well. Teenagers’ lack of driving experience, together with risk-taking behavior, puts them at heightened risk for crashes. The need for skill-building and driving supervision for new drivers is the basis for graduated driver licensing programs, which exist in all US states and Washington, DC. GDL provides longer practice periods, limits driving under high risk conditions for newly licensed drivers, and requires greater participation of parents as their teens learn to drive. Research suggests that the more comprehensive GDL programs are associated with reductions of 26%15 to 41%16 in fatal crashes and reductions of 16%17 to 22%18 in overall crashes, among 16-year-old drivers. When parents know their state’s GDL laws, they can help enforce the laws and, in effect, help keep their teen drivers safe.
CDC’s GDL Planning Guide is designed to assist states to assess, develop, and implement actionable plans to strengthen graduated driver licensing practices.
Additional Resources
Parents Are the Key
![]() Parents, pediatricians, and organizations can find more information on how to keep teens safe on the road at www.cdc.gov/ParentsAreTheKey. There you can download a free Parent-Teen Driving Agreement and other free materials.
Parents, pediatricians, and organizations can find more information on how to keep teens safe on the road at www.cdc.gov/ParentsAreTheKey. There you can download a free Parent-Teen Driving Agreement and other free materials.
Related Pages
- Publications
- Policy Impact: Teen Driver Safety
- CDC Feature: Safe Teen Driving
- CDC Prevention Status Reports: Motor Vehicle Injuries
- Guiding Teen Drivers Podcast (A Minute of Health with CDC [0:59])
- Guiding Teen Drivers Podcast (A Cup of Health with CDC [3:26])
- New to the Road Podcast (A Cup of Health with CDC [4:25])
- Fact Sheet for Employers & Parents—Young Drivers in the Workplace
Be Smart. Be Well. Videos

Check out the series of Be Smart. Be Well. videos on safe teen driving from Blue Cross Blue Shield, in partnership with CDC.
References
- Centers for Disease Control and Prevention. Web-based Injury Statistics Query and Reporting System (WISQARS) [Online]. (2015). National Center for Injury Prevention and Control, Centers for Disease Control and Prevention (producer). [Cited 2017 Apr 11].
- Insurance Institute for Highway Safety (IIHS). Fatality facts: teenagers 2015. Arlington (VA): The Institute; 2016 [cited 2017 Oct 12]. http://www.iihs.org/iihs/topics/t/teenagers/fatalityfacts/teenagers
- Chen L, Baker SP, Braver ER, Li G. Carrying passengers as a risk factor for crashes fatal to 16- and 17-year old drivers. JAMA 2000;283(12):1578–82. http://jama.jamanetwork.com/article.aspx?articleid=192524
- Ouimet MC, Pradhan AK, Brooks-Russell A, Ehsani JP, Berviche D, Simons-Morton BG. Young drivers and their passengers: a systematic review of epidemiological studies on crash risk. 2015. Journal of Adolescent Health 57 (1 Suppl):S24-35.
- Mayhew DR, Simpson HM, Pak A. Changes in collision rates among novice drivers during the first months of driving. Accident Analysis and Prevention 2003;35:683-91.
- McCartt AT, Shabanova VI, Leaf WA.. Driving experiences, crashes, and teenage beginning drivers. Accident Analysis and Prevention 2003;35:311-20.
- Jonah BA, Dawson NE. Youth and risk: age differences in risky driving, risk perception, and risk utility. Alcohol, Drugs and Driving 1987;3:13–29.
- McDonald CC, Curry AE, Kandadai V, Sommers MS, Winston FK. Comparison of teen and adult driver crash scenarios in a nationally representative sample of serious crashes. Accident Analysis & Prevention 2014;72:302-308.
- Simons-Morton B, Lerner N, Singer J. The observed effects of teenage passengers on the risky driving behavior of teenage drivers. Accident Analysis and Prevention 2005;37(6):973-82.
- Centers for Disease Control and Prevention. Youth Risk Behavior Surveillance System 2013 YRBS Data User’s Guide [Online]. (2016). National Center for HIV/AIDS, Viral Hepatitis, STD, and TB Prevention, Division of Adolescent and School Health (producer). [Cited 2016 Sept 20]. https://www.cdc.gov/healthyyouth/data/yrbs/pdf/2015/2015_yrbs-data-users_guide_smy_combined.pdf
- Voas RB, Torres P, Romano E, Lacey JH. Alcohol-related risk of driver fatalities: an update using 2007 data. J Stud Alcohol Drugs 2012;73(3):341-50.
- National Highway Traffic Safety Administration (NHTSA), Dept. of Transportation (US). Traffic safety facts 2014: Young Drivers. Washington (DC): NHTSA; May 2016 [cited 2016 Sept 20]. http://www-nrd.nhtsa.dot.gov/Pubs/812278.pdf
- National Highway Traffic Safety Administration (NHTSA), Dept. of Transportation (US). Traffic safety facts 2014: alcohol-impaired driving. Washington (DC): NHTSA; Dec 2015 [cited 2016 Sept 20]. http://www-nrd.nhtsa.dot.gov/Pubs/812231.pdf
- Kahane CJ. Injury vulnerability and effectiveness of occupant protection technologies for older occupants and women. p. 216. 2013. [cited 2015 Oct 9]. http://www-nrd.nhtsa.dot.gov/Pubs/811766.pdf
- Masten, S.V., Foss, R., & Marshall, S. (2011). Graduated driver licensing and fatal crashes involving 16-to 19-year-old drivers. Journal of the American Medical Association, 306, 1099-1103.
- McCartt, A.T., Teoh, E.R., Fields, M., Braitman, K.A., & Hellinga, L.A. (2010). Graduated licensing laws and fatal crashes of teenage drivers: a national study. Traffic Injury Prevention, 11, 240-248.
- Russell, K.F., Vandermeer, B., Hartling, L. (2011). Graduated driver licensing for reducing motor vehicle crashes among young drivers. Cochrane Database of Systematic Reviews 2011, 10, CD003300
- Zhu, M., Cummings, P., Chu, H., Coben, J., Li, G. (2012) Graduated licensing and motor vehicle crashes involving teenage drivers: an age-stratified meta-analysis. Morgantown, WV: Department of Community Medicine and Injury Control Research Center, West Virginia University.

- Page last reviewed: October 16, 2017
- Page last updated: October 16, 2017
- Content source:
- Centers for Disease Control and Prevention,
- National Center for Injury Prevention and Control,
- Division of Unintentional Injury Prevention