

Explore DPH 500 Cities Interactive Map
 ShareCompartir
The 500 Cities Interactive Map allows users to select a location and view data for that location. By default, the map displays data for all 500 cities. To view city- or census tract-specific data, select the appropriate location type from the navigation menu, and choose a specific location and measure of interest. The map will refresh and display crude and age-adjusted prevalence data for the specific selections made in the navigation menu to the left of the screen.
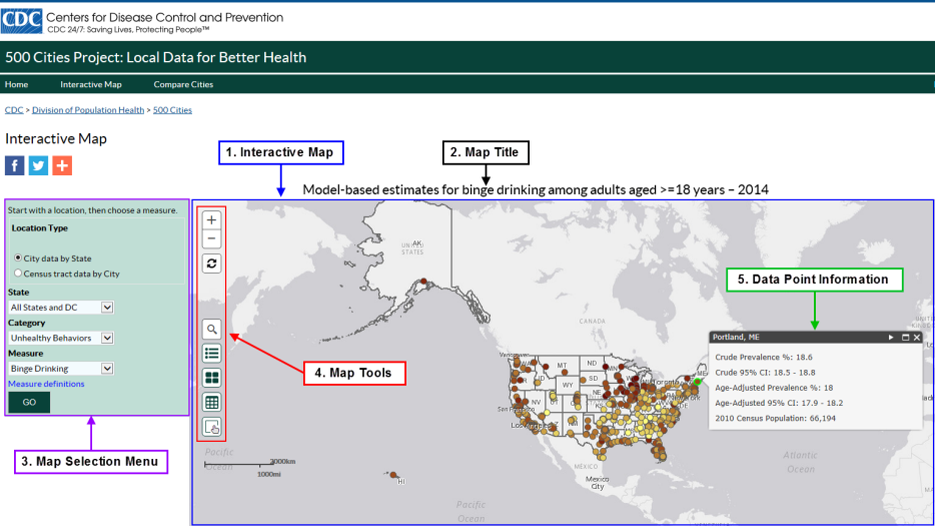
- Interactive Map
By default, the Interactive Map is set to the location type “City data by State,” the category “Unhealthy Behaviors,” and the measure “Binge Drinking.” Because the state drop-down menu is defaulted to “All States and DC,” the map is fully zoomed out to display the entire United States. Use the navigation pane to the left of the map to change selections and refresh the map. - Map Title
The Interactive Map title is measure-dependent. As a user changes his/her selections in the left-hand side navigation pane, the title will change based on the measure selected. The title displays as the “Model based estimates” of the measure name, followed by the year for which data are displayed. - Map Selection Menu
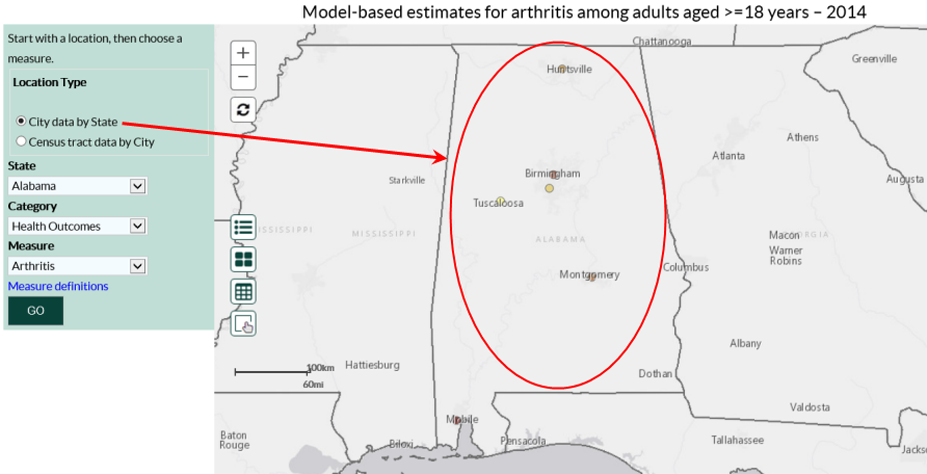
Use the map selection menu to explore a specific location, category, and measure on the interactive map. After making your selections, click the “GO” button and allow the map to refresh and zoom to the location selected from the drop-down menu(s).- Select the location type “City data by State”
Selecting the “City data by State” location type allows you to explore the interactive map at the state-level. Select a state, category, and measure of interest, click “GO,” and begin exploring the map. Use the zoom in (+) feature to zoom in to the census tract-level to explore an area more closely at the state-level.
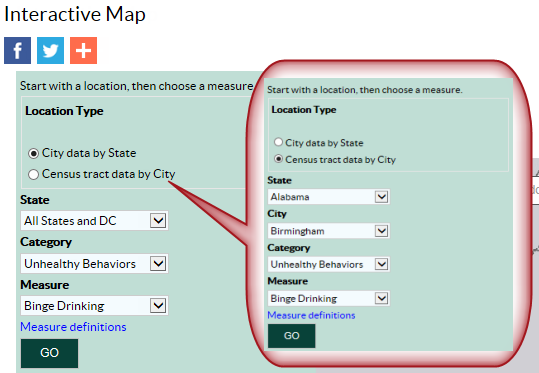
- Select the location type “Census tract data by City”
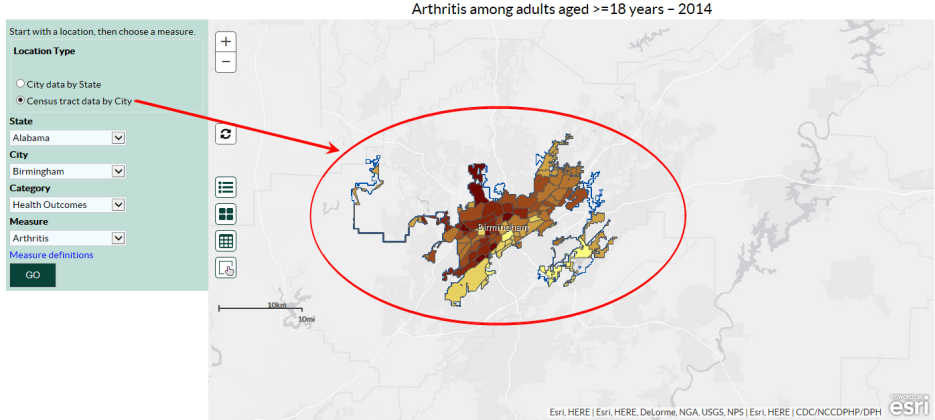
Selecting the location type “Census tract data by City” allows you to explore census tract data in a specific state and city for a category and measure. When this location type is selected, the drop-down menus change so that a city within a state can be selected. Make your selections, click “GO,” and begin exploring the interactive map at the city- and census tract-level.
- Measure Definitions link
Click the link to view measures definitions displayed by Category.
- Select the location type “City data by State”
- Map Tools
Map tools help you navigate the map, and view and understand the data displayed, easily.
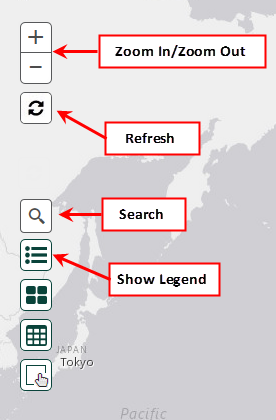
- Zoom In/Zoom Out buttons
Click the buttons to zoom in and out of the Interactive Map. The plus (+) icon allows the user to zoom in. The minus (-) icon allows the user to zoom out. - Refresh button
Click the Refresh button to refresh the Interactive Map back to the original location selections made in the map selection menu.
- Search button
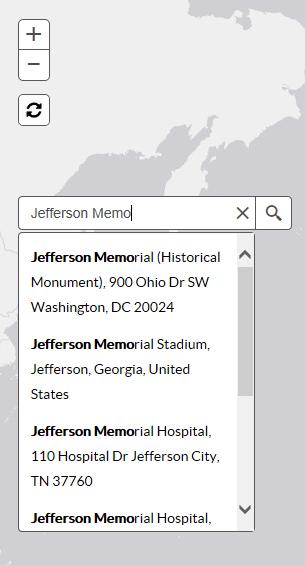
The Search feature is only available when you select the “City data by State” location type from the map selection menu. When you click the Search button, a search bar will expand next to the button. Begin typing in a point of interest, specific address, city, state, or zip code into the search bar and the search box will provide an autocompleted list of possible locations to choose from. Select an option and click the magnifying glass to begin exploring the map. The map will zoom to the location, even if no data is associated with it. Therefore, you may have to zoom out to gain a better perspective of the location you zoomed into on the map.
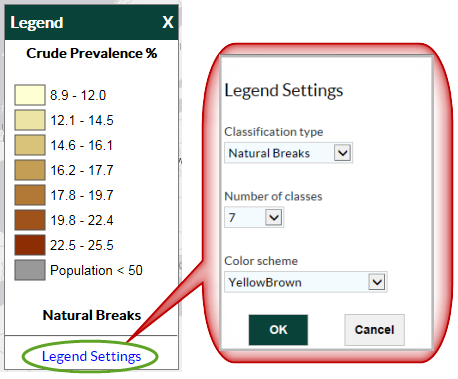
- Legend
A moveable legend will appear when you click the “Show Legend” button. The legend displays categories based on the range of crude prevalence values for the measure selected in the map selection menu. Click the “Legend Settings” hyperlink to change the classification type from the default option of “Natural Breaks,” change the number of classes displayed on the legend, or change the color scheme of the legend colors that correspond to data points on the map. -
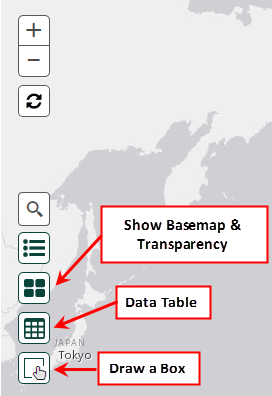
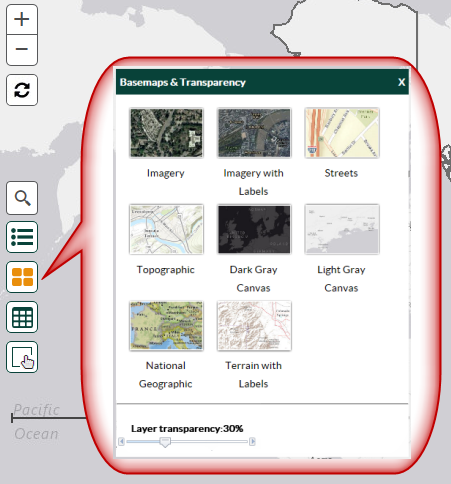
- Basemap & Layer Transparency
Click the button to view a mobile pop-up menu of basemap options and to change the transparency of data points on the map. The Interactive Map displays as a “Light Gray Canvas” basemap and 30% layer transparency. Change the layer transparency of the data points on the map using the slide bar at the bottom of the window. Changing the transparency will make each data point appear more (lighter) or less (darker) transparent against the basemap selected.
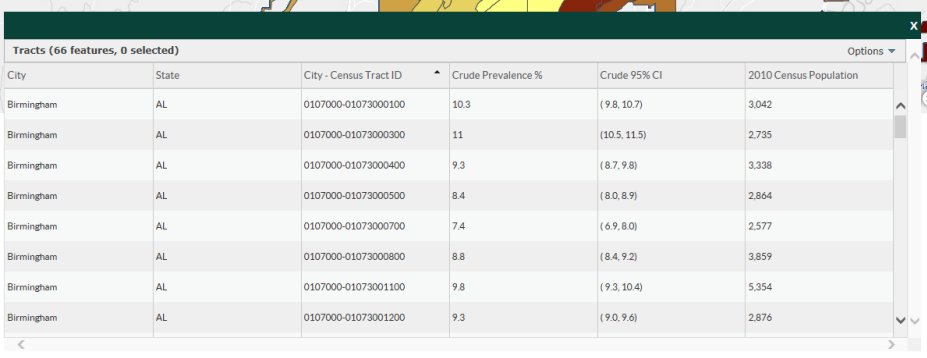
- Data Table
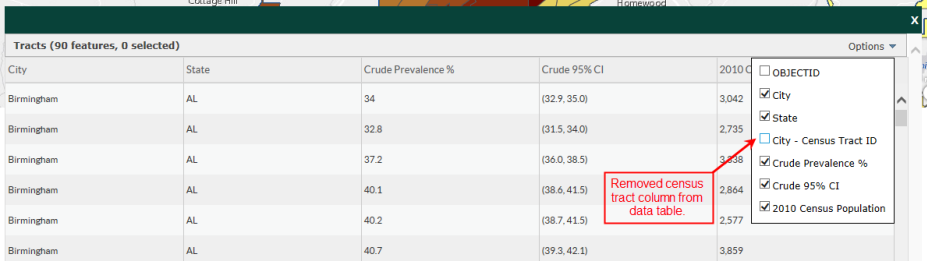
Click the “Show Table” button to display the stationary data table below the map. City and state descriptions, crude estimates and corresponding confidence intervals, and the 2010 census population for all data points captured on the map will display in the data table by default.
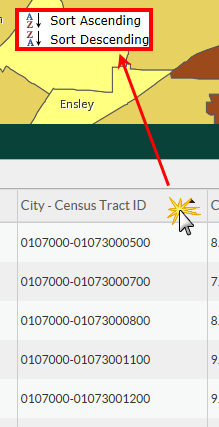
Sort any column in the table by clicking the column header and selecting either “Sort Ascending” or “Sort Descending.”
Click the “Options” drop down menu at the upper right-hand corner of the table to make changes to the table or refresh the table back to its original settings.
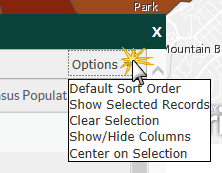
- Default Sort Order – If you changed the sort order on one or more columns, click this option to revert the table back to its default sort order.
- Show Selected Records – The table will refresh as you move the map. Click this option to refresh the table so it captures data associated with the selections made in the map selection menu.
- Clear Selection – Click this option to refresh the table to capture all original features in the map.
- Show/Hide Columns – Click this option to change the columns that appear in the data table.
- Center on Selection - Click to center the map on a location that is highlighted in the data table.
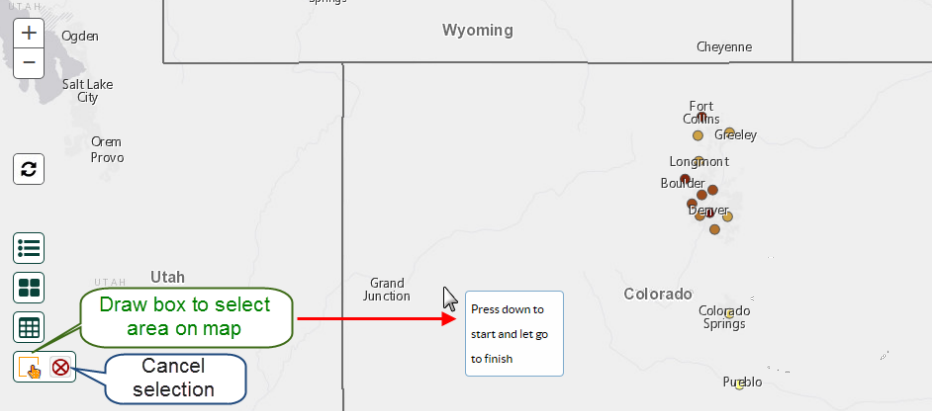
- Draw a Box
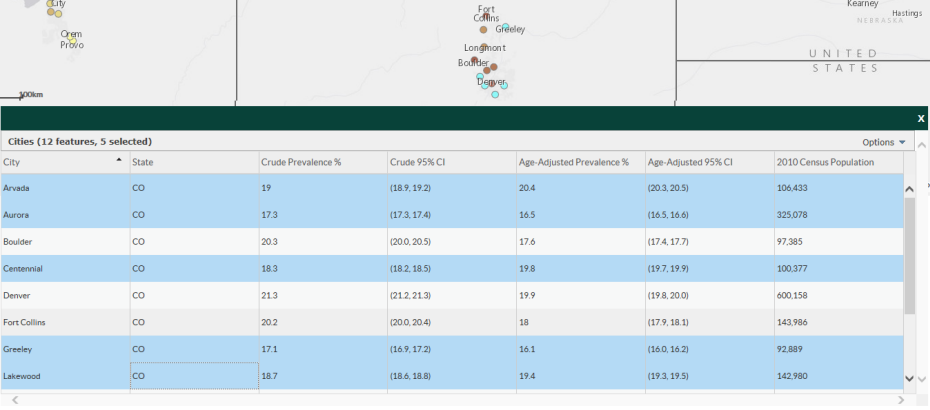
Draw a box on the map to select features for comparison. Select the draw tool, then click and drag on the map to highlight desired features. The table reflects the features selected.
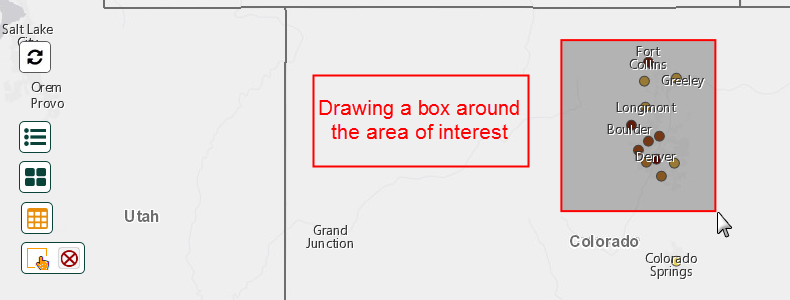
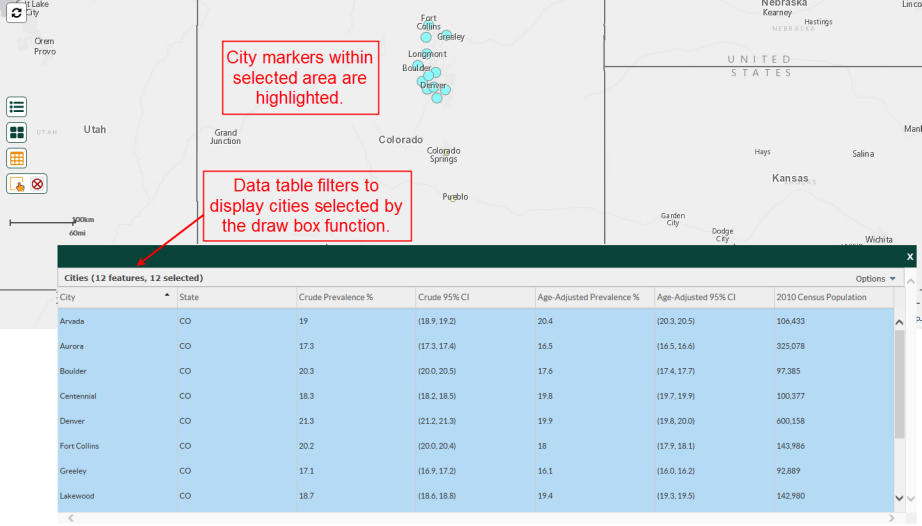
To make another selection, select the draw box button again. Then click and drag to select. Cities captured in the box will appear as highlighted rows in the data table.
Click a single row in the data table to highlight a single city on the map.
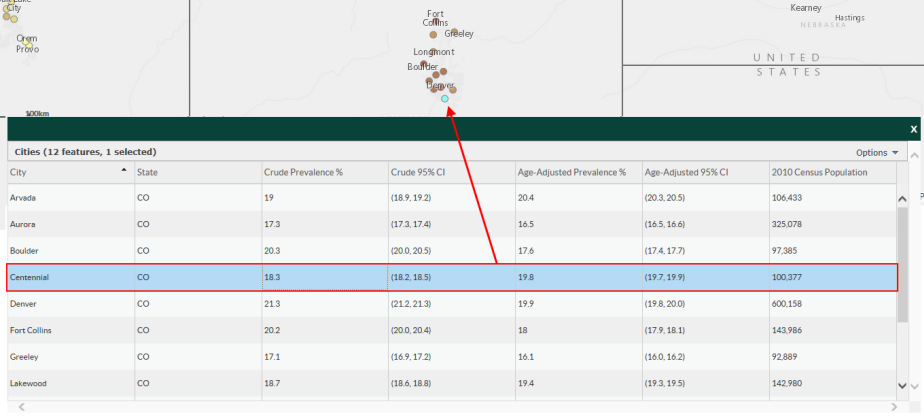
Press Ctrl + A to select multiple rows and highlight multiple cities on the map.
 To cancel your draw box selection, select the “X” option that expands next to the draw box icon. The data table will refresh, displaying rows for all cities displayed on the map.
- Zoom In/Zoom Out buttons
- Data point information – Hover
If you select “City data by State” as the location type and “All States and DC” under the State dropdown menu, the interactive map will display the entire United States on the map. Hover your mouse over any data point (city) on the interactive map and notice that a hover bubble displaying data about that data point appears next to your cursor.
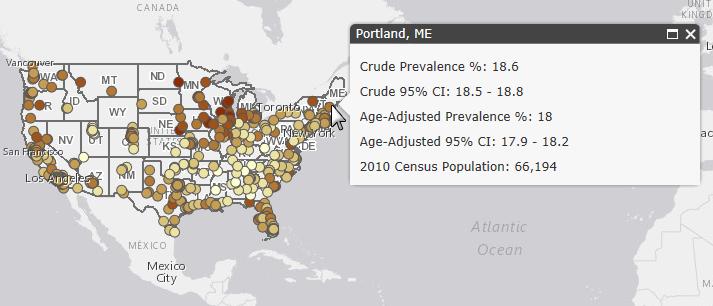
Data displayed in the bubble include: crude and age-adjusted estimates, corresponding confidence intervals, and the 2010 census population for that city.
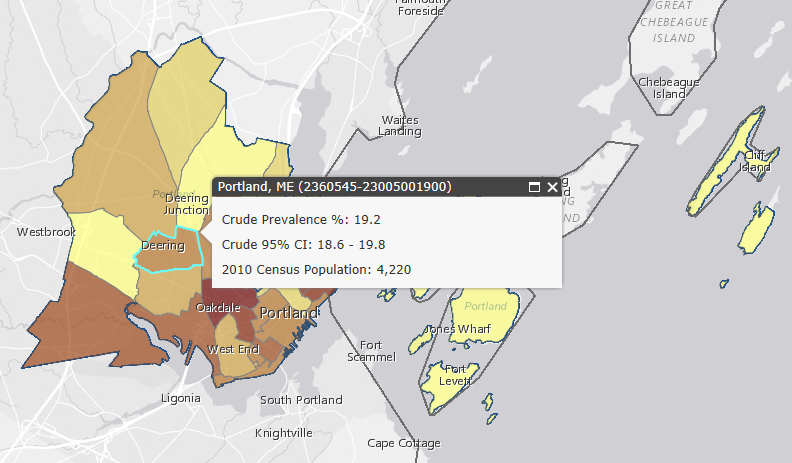
If you select “Census tract data by City” as the location type, make your state, city, category, and measure selections from the drop-down menus, and click “GO,” the interactive map will zoom to the location specified by the map selection menu. The map will display the city and distinguishable census tracts. When you hover your mouse over a census-tract, the census-tract boundary will become highlighted and a hover bubble displaying tract-specific data will appear next to your cursor.
The data displayed in the bubble are simpler and include the crude prevalence, a corresponding confidence interval, and the 2010 census population for that census tract.
- Page last reviewed: January 4, 2017
- Page last updated: January 4, 2017
- Content source: