

Pelvic Inflammatory Disease (PID) Statistics
 ShareCompartir
1 in 8 women with a history of PID experience difficulties getting pregnant.
Most Recent Data
- STD Surveillance 2016 – Pelvic Inflammatory Disease (PID) (September 26, 2017)
- Prevalence of Pelvic Inflammatory Disease in Sexually Experienced Women of Reproductive Age — United States, 2013–2014 – MMWR January 27, 2017
Pelvic Inflammatory Disease — Lifetime Prevalence* Among Sexually Experienced Women† Aged 18–44 Years by Race/Ethnicity and Previous STI‡ Diagnosis, National Health and Nutrition Examination Survey (NHANES), 2013–2014
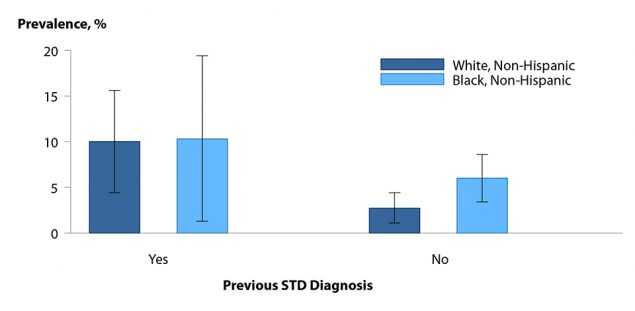
* Prevalence estimates based on response to the question, “Have you ever been treated for an infection in your fallopian tubes, uterus or ovaries, also called a pelvic infection, pelvic inflammatory disease, or PID?”. Estimates were weighted to be nationally representative of the U.S. population, accounting for unequal probabilities of selection and nonresponse.
† Based on a response of “Yes” to the question, “Have you ever had vaginal, anal, or oral sex?”.
‡ STI = sexually transmitted infection. Participants who have been told by a doctor or other healthcare professional in the last 12 months that they had chlamydia or gonorrhea or have ever been told they have herpes, human papillomavirus, or genital warts.
NOTE: Error bars indicate 95% confidence intervals. Prevalence estimates among non-Hispanic Black women with a previous STI diagnosis have a relative standard error >40% but <50%.
SOURCE: Kreisel, K, Torrone, E, Bernstein, K, et al. Prevalence of pelvic inflammatory disease in sexually experienced women of reproductive age — United States, 2013–2014. MMWR Morb Mortal Wkly Rep 2017; 66(3):80–83.
Pelvic Inflammatory Disease — Initial Visits to Physicians’ Offices Among Women Aged 15–44 Years, United States, 2006–2015
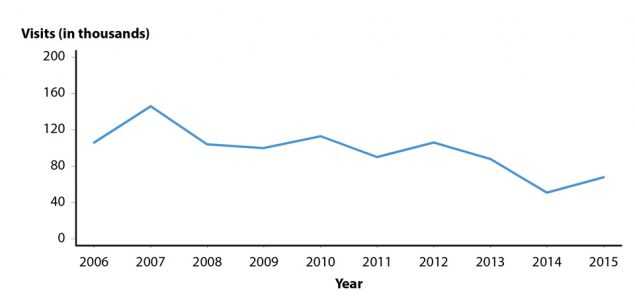
NOTE: The relative standard errors for these estimates are 16%–23%. See section A2.5(https://www.cdc.gov/std/stats16/appendix-a.htm) in the Appendix and Table 44(https://www.cdc.gov/std/stats16/tables/44.htm).
SOURCE: National Disease and Therapeutic Index, IMS Health, Integrated Promotional Services™, IMS Health Report, 1966–2015. The 2016 data were not obtained in time to include them in this report
Source: 2016 STD Surveillance Report
- Page last reviewed: September 27, 2017
- Page last updated: September 27, 2017
- Content source: