


Cyclosporiasis Outbreak Investigations: Epi Curves — United States, 2013 (Final Update)
 ShareCompartir
Last Updated December 2, 2013 9:00 AM EDT
Previous Epi Curves by Month
Epi Curves
The illnesses can be visually described with a graph showing the number of persons who became ill each week. This graph is called an epi curve.
Figure 1. Confirmed Cyclosporiasis Cases, by Groups of States, June—August 2013*
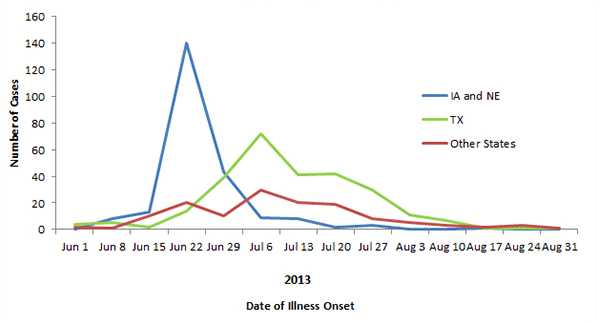
* N=631. Outbreak-associated cases are defined as laboratory-confirmed Cyclospora infection in a person with symptom onset (reported or estimated) between June 1 and August 31, 2013, and no known travel outside the United States or Canada in the 14 days prior to symptom onset.
In the graph above, the number of persons who became ill each week is plotted separately for persons who fell ill in Iowa and Nebraska, in Texas, and in all other states combined, for those cases for which onset of illness dates were available.
The cases reported by Iowa and Nebraska peaked in mid-June, and then decreased to low levels. Cases reported from Texas increased more slowly, reaching a peak in late June-early July, before declining moderately. Cases reported in other parts of the country occurred in lower numbers through June and July, without a distinct peak. This suggests that there was more than one outbreak of cyclosporiasis during June–August 2013 in the United States.
| Week of Illness Onset |
Number of Cases in IA and NE |
Number of Cases in TX |
Number of Cases in Other States |
|---|---|---|---|
| Jun 1 | 7 | 8 | 2 |
| Jun 8 | 10 | 3 | 9 |
| Jun 15 | 123 | 13 | 21 |
| Jun 22 | 61 | 29 | 11 |
| Jun 29 | 8 | 72 | 27 |
| Jul 6 | 12 | 47 | 22 |
| Jul 13 | 2 | 41 | 16 |
| Jul 20 | 2 | 33 | 13 |
| Jul 27 | 0 | 13 | 5 |
| Aug 3 | 0 | 7 | 3 |
| Aug 10 | 0 | 2 | 3 |
| Aug 17 | 1 | 1 | 2 |
| Aug 24 | 0 | 1 | 1 |
Figure 2. Confirmed Cyclosporiasis Cases by Week of Illness Onset, United States*
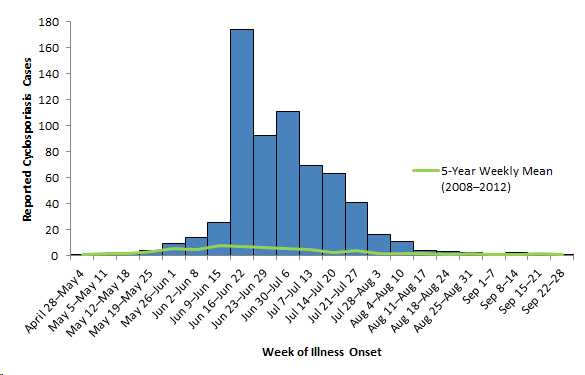
*A total of 645 reported cases not know to be international travel associated had onset of illness between April 28 and September 28, 2013. Of these reported cases, 631 were outbreak associated. Outbreak-associated cases are defined as laboratory-confirmed Cyclospora infection in a person with symptom onset (reported or estimated) between June 1 and August 31, 2013, and no known travel outside of the United States or Canada in the 14 days prior to symptom onset. Reported cases of cyclosporiasis in the United States have returned to baseline levels, as shown by the green line; therefore, it is likely that the outbreaks identified during June–August 2013 have ended. The number of reports of persons with illness increased beginning in June and returned to baseline in mid-to-late August.
« Read the full Outbreak Investigation
| Week of Illness Onset | Number of Cases | 5-Year Weekly Mean |
|---|---|---|
| April 28–May 4 | 1 | 0.6 |
| May 5–May 11 | 0 | 1.8 |
| May 12–May 18 | 2 | 1.2 |
| May 19–May 25 | 4 | 2.8 |
| May 26–Jun 1 | 9 | 5.2 |
| Jun 2–Jun 8 | 14 | 4.6 |
| Jun 9–Jun 15 | 25 | 7.6 |
| Jun 16–Jun 22 | 174 | 6.8 |
| Jun 23–Jun 29 | 92 | 6.2 |
| Jun 30–Jul 6 | 111 | 5.6 |
| Jul 7–Jul 13 | 69 | 4.8 |
| Jul 14–Jul 20 | 63 | 2.2 |
| Jul 21–Jul 27 | 41 | 3.8 |
| Jul 28–Aug 3 | 16 | 1.4 |
| Aug 4–Aug 10 | 11 | 1.4 |
| Aug 11–Aug 17 | 4 | 1.6 |
| Aug 18–Aug 24 | 3 | 0.8 |
| Aug 25–Aug 31 | 2 | 1.8 |
| Sep 1–7 | 1 | 0.8 |
| Sep 8–14 | 2 | 1 |
| Sep 15–21 | 0 | 1.4 |
| Sep 22–28 | 1 | 1 |
- Page last reviewed: October 29, 2013
- Page last updated: October 29, 2013
- Content source: