

Adult Obesity Prevalence Maps
 ShareCompartir
Obesity Prevalence in 2016 by Education and Age
- Obesity decreased by level of education. Adults without a high school degree or equivalent had the highest self-reported obesity (35.5%), followed by high school graduates (32.3%), adults with some college (31.0%) and college graduates (22.2%).
- Young adults were half as likely to have obesity as middle-aged adults. Adults aged 18-24 had the lowest self-reported obesity (17.3%) compared to adults aged 45-54 years who had the highest prevalence (35.1%).
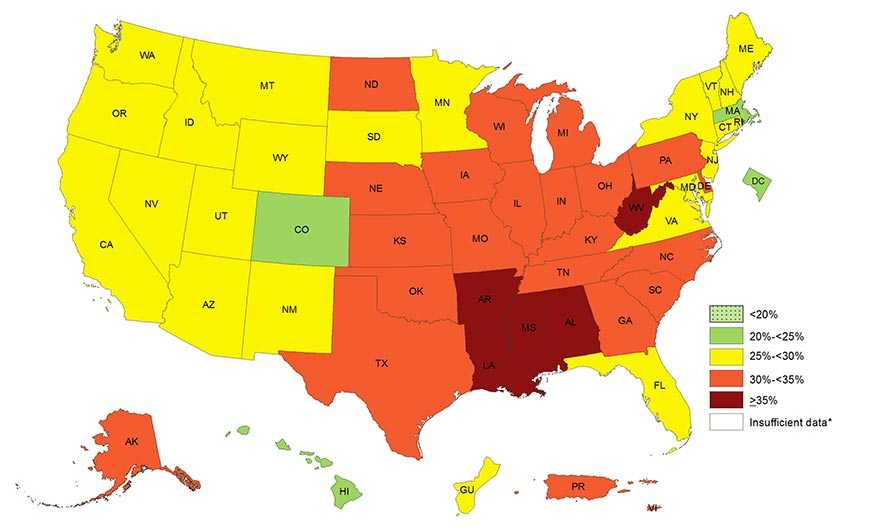
Obesity Prevalence in 2016 Varies Across States and Territories
- All states had more than 20% of adults with obesity.
- 20% to less than 25% of adults had obesity in 3 states (Colorado, Hawaii, and Massachusetts) and the District of Columbia.
- 25% to less than 30% of adults had obesity in 22 states and Guam.
- 30% to less than 35% of adults had obesity in 20 states, Puerto Rico, and Virgin Islands.
- 35% or more adults had obesity in 5 states (Alabama, Arkansas, Louisiana, Mississippi, and West Virginia).
- The South had the highest prevalence of obesity (32.0%), followed by the Midwest (31.4%), the Northeast (26.9%), and the West (26.0%).
Prevalence¶ of Self-Reported Obesity Among U.S. Adults by State and Territory, BRFSS, 2016
Prevalence estimates reflect BRFSS methodological changes started in 2011. These estimates should not be compared to prevalence estimates before 2011.
Source: Behavioral Risk Factor Surveillance System
*Sample size <50 or the relative standard error (dividing the standard error by the prevalence) ≥ 30%
View Data Table
| Prevalence of Self-Reported Obesity Among U.S. Adults by State and Territory, BRFSS, 2016 |
||
|---|---|---|
| State | Prevalence | 95% CI |
| Alabama | 35.7 | (34.2, 37.3) |
| Alaska | 31.4 | (28.5, 34.4) |
| Arizona | 29.0 | (27.5, 30.6) |
| Arkansas | 35.7 | (33.3, 38.1) |
| California | 25.0 | (23.9, 26.1) |
| Colorado | 22.3 | (21.4, 23.2) |
| Connecticut | 26.0 | (24.8, 27.2) |
| Delaware | 30.7 | (28.7, 32.8) |
| District of Columbia | 22.6 | (20.9, 24.3) |
| Florida | 27.4 | (26.4, 28.5) |
| Georgia | 31.4 | (29.7, 33.2) |
| Guam | 28.3 | (25.1, 31.7) |
| Hawaii | 23.8 | (22.5, 25.2) |
| Idaho | 27.4 | (25.6, 29.3) |
| Illinois | 31.6 | (29.9, 33.3) |
| Indiana | 32.5 | (31.2, 33.8) |
| Iowa | 32.0 | (30.5, 33.4) |
| Kansas | 31.2 | (30.1, 32.3) |
| Kentucky | 34.2 | (32.7, 35.6) |
| Louisiana | 35.5 | (33.4, 37.7) |
| Maine | 29.9 | (28.5, 31.3) |
| Maryland | 29.9 | (28.9, 31.0) |
| Massachusetts | 23.6 | (22.3, 24.9) |
| Michigan | 32.5 | (31.4, 33.6) |
| Minnesota | 27.8 | (26.9, 28.6) |
| Mississippi | 37.3 | (35.4, 39.1) |
| Missouri | 31.7 | (30.0, 33.4) |
| Montana | 25.5 | (23.9, 27.2) |
| Nebraska | 32.0 | (30.8, 33.2) |
| Nevada | 25.8 | (23.9, 27.8) |
| New Hampshire | 26.6 | (25.0, 28.2) |
| New Jersey | 27.4 | (25.7, 29.1) |
| New Mexico | 28.3 | (26.6, 30.1) |
| New York | 25.5 | (24.6, 26.5) |
| North Carolina | 31.8 | (30.4, 33.3) |
| North Dakota | 31.9 | (30.3, 33.6) |
| Ohio | 31.5 | (30.2, 32.8) |
| Oklahoma | 32.8 | (31.2, 34.3) |
| Oregon | 28.7 | (27.3, 30.3) |
| Pennsylvania | 30.3 | (28.8, 31.8) |
| Puerto Rico | 30.7 | (29.0, 32.5) |
| Rhode Island | 26.6 | (24.9, 28.4) |
| South Carolina | 32.3 | (31.0, 33.6) |
| South Dakota | 29.6 | (27.6, 31.7) |
| Tennessee | 34.8 | (33.0, 36.7) |
| Texas | 33.7 | (31.9, 35.4) |
| Utah | 25.4 | (24.2, 26.5) |
| Vermont | 27.1 | (25.5, 28.7) |
| Virgin Islands | 32.5 | (28.6, 36.6) |
| Virginia | 29.0 | (27.7, 30.3) |
| Washington | 28.6 | (27.6, 29.6) |
| West Virginia | 37.7 | (36.3, 39.0) |
| Wisconsin | 30.7 | (29.0, 32.5) |
| Wyoming | 27.7 | (25.7, 29.8) |
Prevalence of Self –Reported Obesity Among U.S. Adults by Race/Ethnicity, State and Territory, BRFSS, 2014-2016
Combining data from 2014 through 2016, non-Hispanic blacks had the highest prevalence of self-reported obesity (38.3%), followed by Hispanics (32.5%) and non-Hispanic whites (28.1%).
Prevalence of Self-Reported Obesity Among Non-Hispanic White Adults by State and Territory,
BRFSS, 2014-2016
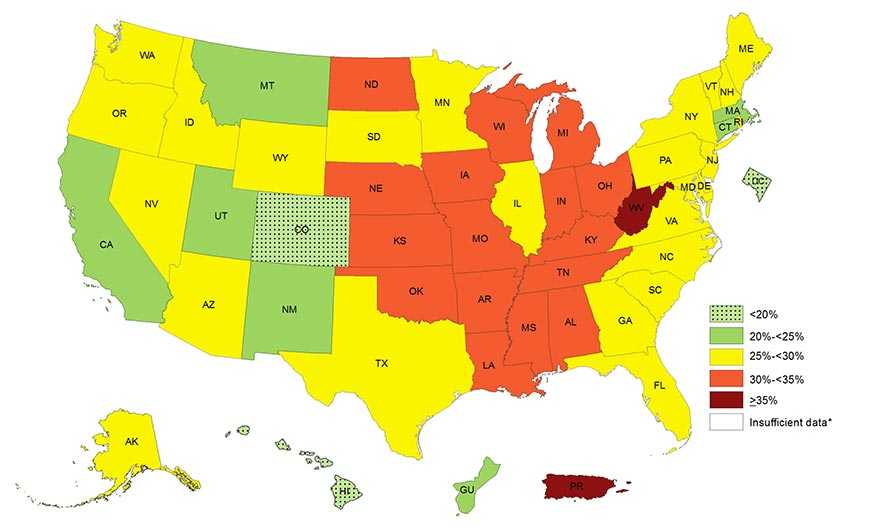
Source: Behavioral Risk Factor Surveillance System
*Sample size <50 or the relative standard error (dividing the standard error by the prevalence) ≥ 30%
View Data Table
| Prevalence of Self-Reported Obesity Among Non-Hispanic White Adults by State and Territory, BRFSS, 2014-2016 |
||
|---|---|---|
| State | Prevalence | 95% CI |
| Alabama | 32.4 | (31.4, 33.4) |
| Alaska | 28.7 | (27.2, 30.2) |
| Arizona | 26.0 | (25.1, 26.9) |
| Arkansas | 34.0 | (32.5, 35.4) |
| California | 22.7 | (21.9, 23.6) |
| Colorado | 19.8 | (19.2, 20.4) |
| Connecticut | 24.3 | (23.5, 25.1) |
| Delaware | 29.4 | (28.0, 30.9) |
| District of Columbia | 9.7 | (8.5, 11.2) |
| Florida | 25.7 | (24.9, 26.5) |
| Georgia | 28.9 | (27.7, 30.1) |
| Guam | 24.8 | (19.9, 30.5) |
| Hawaii | 17.6 | (16.3, 19.0) |
| Idaho | 27.6 | (26.6, 28.7) |
| Illinois | 29.2 | (28.1, 30.3) |
| Indiana | 31.8 | (30.9, 32.7) |
| Iowa | 31.9 | (31.1, 32.8) |
| Kansas | 31.5 | (30.9, 32.1) |
| Kentucky | 33.4 | (32.4, 34.3) |
| Louisiana | 32.6 | (31.4, 33.9) |
| Maine | 29.5 | (28.7, 30.3) |
| Maryland | 27.8 | (26.8, 28.8) |
| Massachusetts | 22.9 | (22.2, 23.7) |
| Michigan | 30.7 | (29.9, 31.4) |
| Minnesota | 27.3 | (26.8, 27.8) |
| Mississippi | 31.9 | (30.6, 33.3) |
| Missouri | 30.7 | (29.7, 31.8) |
| Montana | 24.4 | (23.5, 25.4) |
| Nebraska | 30.8 | (30.1, 31.5) |
| Nevada | 26.2 | (24.7, 27.9) |
| New Hampshire | 27.2 | (26.3, 28.2) |
| New Jersey | 25.4 | (24.5, 26.4) |
| New Mexico | 23.9 | (22.7, 25.2) |
| New York | 25.1 | (24.3, 25.9) |
| North Carolina | 28.1 | (27.2, 29.1) |
| North Dakota | 31.5 | (30.5, 32.6) |
| Ohio | 30.8 | (30.0, 31.7) |
| Oklahoma | 32.3 | (31.3, 33.2) |
| Oregon | 29.0 | (28.1, 30.0) |
| Pennsylvania | 29.5 | (28.6, 30.4) |
| Puerto Rico | 36.0 | (24.8, 49.0) |
| Rhode Island | 26.0 | (24.9, 27.1) |
| South Carolina | 28.9 | (28.1, 29.8) |
| South Dakota | 29.5 | (28.4, 30.7) |
| Tennessee | 31.3 | (30.2, 32.4) |
| Texas | 29.2 | (28.1, 30.3) |
| Utah | 24.9 | (24.3, 25.6) |
| Vermont | 25.7 | (24.9, 26.6) |
| Virginia | 27.3 | (26.5, 28.2) |
| Washington | 28.2 | (27.5, 28.8) |
| West Virginia | 36.0 | (35.2, 36.9) |
| Wisconsin | 30.5 | (29.5, 31.5) |
| Wyoming | 27.9 | (26.8, 29.2) |
Prevalence of Self-Reported Obesity Among Non-Hispanic Black Adults by State and Territory,
BRFSS, 2014-2016
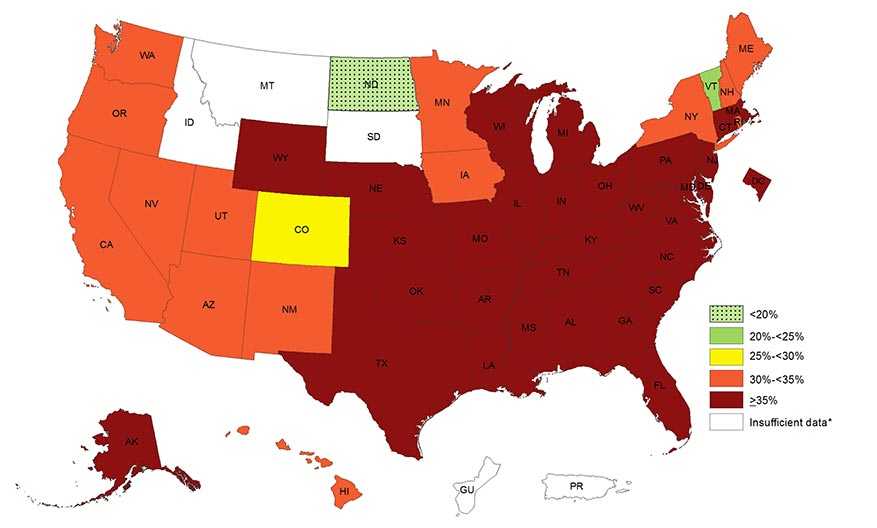
Source: Behavioral Risk Factor Surveillance System
*Sample size <50 or the relative standard error (dividing the standard error by the prevalence) ≥ 30%
View Data Table
| Prevalence of Self-Reported Obesity Among Non-Hispanic Black Adults by State and Territory, BRFSS, 2014-2016 |
||
|---|---|---|
| State | Prevalence | 95% CI |
| Alabama | 44.1 | (42.3, 46.0) |
| Alaska | 43.6 | (32.6, 55.1) |
| Arizona | 33.1 | (28.6, 38.0) |
| Arkansas | 44.2 | (40.3, 48.3) |
| California | 31.0 | (28.2, 34.0) |
| Colorado | 29.1 | (25.4, 33.0) |
| Connecticut | 37.7 | (34.8, 40.8) |
| Delaware | 36.5 | (33.4, 39.8) |
| District of Columbia | 35.5 | (33.4, 37.6) |
| Florida | 35.2 | (32.8, 37.6) |
| Georgia | 37.7 | (35.6, 39.9) |
| Guam | Insufficient data* | Insufficient data* |
| Hawaii | 31.3 | (22.3, 41.9) |
| Idaho | Insufficient data* | Insufficient data* |
| Illinois | 41.3 | (38.2, 44.4) |
| Indiana | 41.7 | (38.2, 45.3) |
| Iowa | 32.1 | (25.9, 38.9) |
| Kansas | 43.1 | (40.0, 46.3) |
| Kentucky | 42.4 | (38.5, 46.4) |
| Louisiana | 42.9 | (40.7, 45.2) |
| Maine | 34.3 | (23.2, 47.4) |
| Maryland | 38.1 | (36.3, 40.0) |
| Massachusetts | 36.6 | (33.0, 40.4) |
| Michigan | 37.4 | (35.1, 39.7) |
| Minnesota | 30.4 | (27.4, 33.5) |
| Mississippi | 44.6 | (42.7, 46.6) |
| Missouri | 38.6 | (35.2, 42.1) |
| Montana | Insufficient data* | Insufficient data* |
| Nebraska | 37.2 | (32.8, 41.9) |
| Nevada | 30.8 | (25.8, 36.2) |
| New Hampshire | 30.3 | (19.2, 44.2) |
| New Jersey | 37.2 | (34.7, 39.8) |
| New Mexico | 34.4 | (26.2, 43.7) |
| New York | 32.1 | (30.1, 34.3) |
| North Carolina | 40.2 | (38.3, 42.2) |
| North Dakota | 15.9 | (9.6, 25.2) |
| Ohio | 37.6 | (34.7, 40.5) |
| Oklahoma | 36.6 | (33.0, 40.4) |
| Oregon | 30.2 | (21.4, 40.6) |
| Pennsylvania | 36.4 | (33.5, 39.5) |
| Puerto Rico | Insufficient data* | Insufficient data* |
| Rhode Island | 31.9 | (27.2, 37.1) |
| South Carolina | 41.7 | (40.2, 43.3) |
| South Dakota | Insufficient data* | Insufficient data* |
| Tennessee | 45.1 | (41.7, 48.6) |
| Texas | 42.4 | (39.2, 45.7) |
| Utah | 30.1 | (22.3, 39.1) |
| Vermont | 21.9 | (13.3, 33.9) |
| Virginia | 39.4 | (37.4, 41.4) |
| Washington | 34.2 | (29.9, 38.7) |
| West Virginia | 44.6 | (39.3, 50.1) |
| Wisconsin | 39.9 | (34.0, 46.1) |
| Wyoming | 43.8 | (29.3, 59.4) |
| *Sample size <50 or the relative standard error (dividing the standard error by the prevalence) ≥ 30%. | ||
Prevalence of Self-Reported Obesity Among Hispanic Adults by State and Territory,
BRFSS, 2014-2016
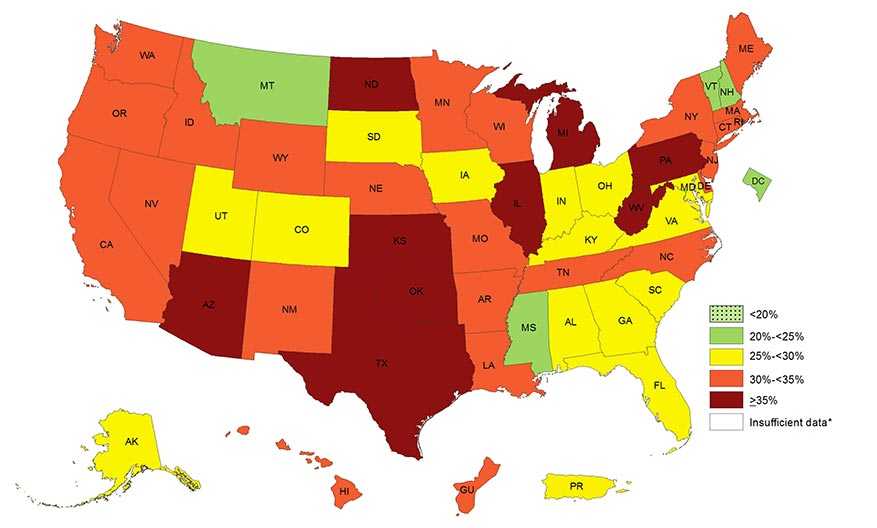
Source: Behavioral Risk Factor Surveillance System
*Sample size <50 or the relative standard error (dividing the standard error by the prevalence) ≥ 30%
View Data Table
| Prevalence of Self-Reported Obesity Among Hispanic Adults by State and Territory, BRFSS, 2014-2016 |
||
|---|---|---|
| State | Prevalence | 95% CI |
| Alabama | 28.1 | (21.7, 35.6) |
| Alaska | 27.9 | (21.3, 35.5) |
| Arizona | 35.0 | (32.8, 37.2) |
| Arkansas | 32.4 | (25.4, 40.3) |
| California | 32.3 | (31.1, 33.5) |
| Colorado | 27.1 | (25.5, 28.8) |
| Connecticut | 30.3 | (28.0, 32.8) |
| Delaware | 32.1 | (27.6, 37.1) |
| District of Columbia | 20.0 | (15.0, 26.1) |
| Florida | 26.8 | (25.1, 28.6) |
| Georgia | 28.4 | (23.9, 33.4) |
| Guam | 32.6 | (27.0, 38.7) |
| Hawaii | 31.4 | (28.3, 34.6) |
| Idaho | 33.6 | (29.3, 38.2) |
| Illinois | 36.3 | (33.2, 39.6) |
| Indiana | 28.7 | (24.9, 32.9) |
| Iowa | 29.9 | (24.9, 35.5) |
| Kansas | 35.2 | (32.8, 37.6) |
| Kentucky | 25.0 | (18.4, 33.0) |
| Louisiana | 32.2 | (25.9, 39.2) |
| Maine | 30.5 | (22.5, 39.9) |
| Maryland | 25.4 | (21.6, 29.5) |
| Massachusetts | 31.4 | (28.8, 34.2) |
| Michigan | 38.4 | (33.8, 43.3) |
| Minnesota | 33.1 | (30.0, 36.3) |
| Mississippi | 22.3 | (14.2, 33.4) |
| Missouri | 32.7 | (26.1, 40.2) |
| Montana | 24.8 | (19.1, 31.7) |
| Nebraska | 31.8 | (29.1, 34.7) |
| Nevada | 30.6 | (27.3, 34.1) |
| New Hampshire | 24.7 | (17.7, 33.4) |
| New Jersey | 31.4 | (29.1, 33.7) |
| New Mexico | 31.3 | (29.7, 33.0) |
| New York | 30.6 | (28.7, 32.5) |
| North Carolina | 31.2 | (28.1, 34.4) |
| North Dakota | 37.2 | (28.8, 46.5) |
| Ohio | 27.8 | (22.7, 33.5) |
| Oklahoma | 36.7 | (32.7, 41.0) |
| Oregon | 32.4 | (28.6, 36.6) |
| Pennsylvania | 39.5 | (34.3, 45.0) |
| Puerto Rico | 29.4 | (28.5, 30.4) |
| Rhode Island | 30.8 | (27.4, 34.4) |
| South Carolina | 28.2 | (23.9, 33.0) |
| South Dakota | 29.5 | (20.0, 41.3) |
| Tennessee | 33.0 | (25.1, 42.0) |
| Texas | 37.4 | (35.7, 39.1) |
| Utah | 28.1 | (26.0, 30.4) |
| Vermont | 24.3 | (16.7, 34.1) |
| Virginia | 29.6 | (26.1, 33.3) |
| Washington | 34.4 | (31.7, 37.1) |
| West Virginia | 37.7 | (28.7, 47.6) |
| Wisconsin | 31.2 | (25.7, 37.1) |
| Wyoming | 32.4 | (27.2, 38.1) |
Download the Adult Obesity Maps by State and Territory
CDC’s Data, Trends, and Maps Interactive Tool provides additional state and territory adult obesity prevalence estimates.
Download the Adult Race/Ethnicity Obesity Maps by State and Territory
The state and territory adult obesity prevalence by Race/Ethnicity in 2014-2016 are depicted in a Powerpoint slide presentation format [PPT-2.90MB]. This is also available as an Acrobat file [PDF-507KB]
The state and territory adult obesity prevalence by Race/Ethnicity in 2011-2013, 2012-2014 and 2013-2015 are depicted in a Powerpoint slide presentation format [PPT-1.38MB]. This is also available as an Acrobat file [PDF-3.30MB].
Changed System, New Baseline
Like all public health surveillance systems, BRFSS must occasionally change its methods to adapt to the changing world and to maintain validity. The improvement changes to the BRFSS affect obesity prevalence estimates, and mean that estimates from data collected in 2010 and before cannot be compared estimates from data collected in 2011 and forward. Learn more about the changes to the BRFSS.
Download the Historical Maps
The history of the increase in state obesity prevalence is depicted in a PowerPoint slide presentation format [PPT-3.01MB]. Estimates of obesity prevalence from 2011 forward cannot be compared to estimates from previous years. This is also available as an Acrobat file [PDF-98KB].
- Page last reviewed: August 31, 2017
- Page last updated: August 31, 2017
- Content source: