

Data, Trends and Maps
 ShareCompartir
Surveillance depends on the most accurate and latest data available. The obesity prevalence maps and interactive databases are provided in this section. The obesity maps offer state and territory level estimates of the U.S. adult obesity prevalence. Use the interactive database systems to find state level nutrition, physical activity, and obesity, data, trends and legislation information.
 Data, Trends and Maps Database
The Division of Nutrition, Physical Activity and Obesity’s Data, Trends and Maps is an interactive tool that provides state-specific data about obesity, nutrition, physical activity and breastfeeding. You can view statistics in a variety of formats, including maps, tables and trend lines. Explore Data, Trends and Maps.
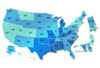
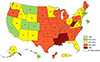 Obesity Prevalence Maps
The Obesity Maps depict self-reported obesity prevalence among U.S. adults. This section offers obesity data maps by state and territory, Powerpoint slides and information about the data methodology and previous years.
 Chronic Disease State Tracking System
The Chronic Disease State Tracking System is a searchable database that provides legislation information pertaining to nutrition, physical activity and obesity. It provides bill numbers, year, congressional sponsor; a short summary of the legislation; and its current status.
- Page last reviewed: April 10, 2017
- Page last updated: April 10, 2017
- Content source: