

CDC Reports Improvement in Childhood Obesity among Young Children Participating in WIC
 ShareCompartir

A new study shows that 34 of 56 WIC State Agencies are seeing modest decreases in obesity among young children from 2010-2014. The percentage of low-income children (ages 2-4) with obesity enrolled in the Special Supplemental Nutrition Program for Women, Infants, and Children (WIC) decreased from 15.9% in 2010 to 14.5% in 2014.
These findings come from a study from the Centers for Disease Control and Prevention (CDC) and the United States Department of Agriculture (USDA). Researchers analyzed obesity trends from 2000 to 2014 among young children aged 2-4 years from low-income families enrolled in (WIC). The study was recently published in the Morbidity and Mortality Weekly Report. Trends in Obesity among Participants Aged 2-4 Years in the Supplemental Nutrition Program for Women, Infants, and Children—United States, 2000-2014[PDF-490KB]
What is WIC?
WIC is a federal program that promotes healthy eating and nutrition education for infants and children up to age 5, and low-income women who are pregnant, postpartum, or breastfeeding. Nutrition during pregnancy and early childhood is critical for healthy child growth and development. To be eligible for WIC, women, infants, and children must meet residential, income, and nutrition risk requirements.
What do the results show? The results show that in 2014 childhood obesity prevalence among low-income toddlers varied by state, ranging from about 8% in Utah to 20% in Virginia.
Change in Obesity Prevalence among WIC Participants Aged 2-4 Years, by WIC State Agency
—United States, 2010-2014
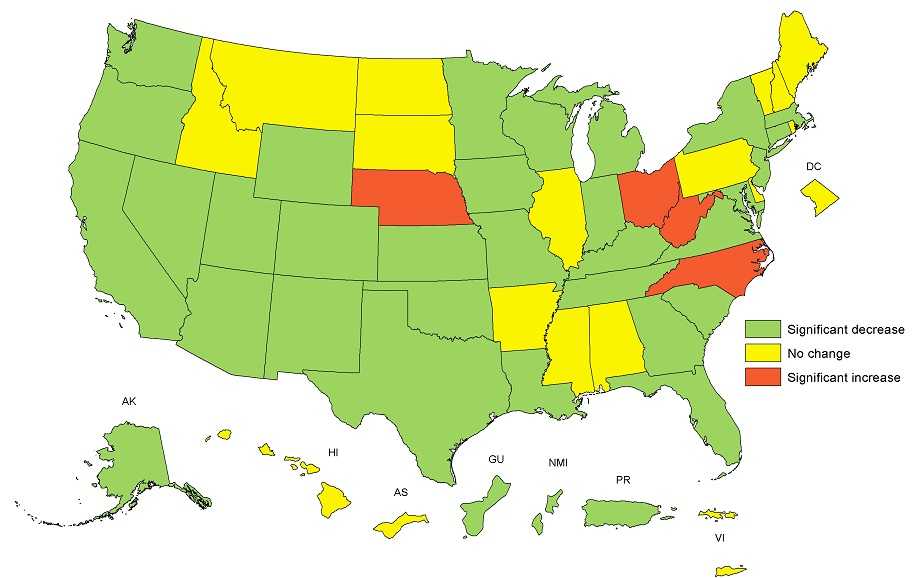
Change in the adjusted state-specific obesity prevalence were statistically significant if the 95% CI did not include 0. Adjusted obesity prevalence change was calculated based on obesity prevalence in 2010 and prevalence ratio between 2014 and 2010 calculated from log binomial regression model adjusted for child’s age, sex, and race/ethnicity.
While Hispanic and American Indian/Alaska Native WIC toddlers had higher proportions of children with obesity throughout the entire study period (2000-2014), modest improvements in obesity prevalence were seen across all 5 major ethnic groups from 2010 to 2014.
These include:
- Non-Hispanic blacks (From 12.7% to 11.9% = -.8%)
- Non-Hispanic whites (From 12.8 to 12.2% = -.6%)
- Hispanics (From 19.3% to 17.3% = -2.0%)
- Asians/Pacific Islanders (From 12.5% to 11.1% = -1.4%)
- American Indians/Alaska Native (From 20.9% to 18.0% = -2.9%)

What is contributing to the improvement?
These modest decreases in obesity among young children are most likely due to a combination of childhood obesity efforts under way at the national, state, community and family levels. Examples of federal efforts include:
USDA’s revision of the WIC food package
In 2009, changes made to WIC food packages have contributed to healthier food environments in low-income neighborhoods. This support has increased access to fruits, vegetables, and whole grains for all consumers, leading to healthy nutrition behaviors, especially among women and children enrolled in WIC.
CDC’s Early Care and Education (ECE) Childhood Obesity program
CDC’s Division of Nutrition, Physical Activity, and Obesity works in a variety of ways to help providers offer a healthy environment for children in Early Child and Education (ECE) programs across the United States. Examples include:
- Funding all 50 states and D.C. to address childhood obesity prevention in ECE settings as well as offering training, tools, and resources to state and local health agencies and ECE providers to help young children develop healthy habits early.
- Leading public-private partnerships dedicated to advancing research, policies, and practices that promote obesity prevention in the ECE setting.
The Let’s Move! Initiative
This initiative is committed to solving the challenge of childhood obesity within a generation. Among its sub-initiatives are Let’s Move! Child Care (LMCC) and Let’s Move! Cities, Towns and Counties (LMCTC).
- As of September 2016, over 20,000 ECE providers (serving more than 1.1 million children) pledged to apply best practices for food, beverages, breastfeeding support, physical activity, and screen time through participation in the LMCC initiative.
- Let’s Move! Cities, Towns and Counties (LMCTC) has reached over 500 cities, towns, and counties.
How can state and local leaders keep up this progress?
- Enroll low-income families into programs, such as WIC and healthier retail initiatives such as Double Up Bucks Programs, to help them get affordable, nutritious foods.
- Encourage child care centers that serve low-income families to participate in the USDA’s Child and Adult Care Food Program (CACFP). Through CACFP more than 3.3 million children and 120,000 adults receive nutritious meals and snacks each day as part of the day care they receive.
- Partner with civic leaders and child care providers through community coalitions to make community-wide changes that will promote healthy eating and active living for all members of the community.
- Learn what policies and system supports are used in your state to prevent childhood obesity.
Visit DNPAO’s Early Care and Education (ECE) to view the recent ECE State Indicator Report!

What is CDC doing to help prevent childhood obesity?
- We conduct research on how best to address childhood obesity at the community level. CDC funds communities to implement and evaluate clinical and community-based childhood obesity prevention and treatment programs for children aged 2-12 that are eligible for Medicaid or Children’s Health Insurance Program (CHIP) benefits though Childhood Obesity Research and Demonstration (CORD) projects. Strategies include 1) screening and counseling of all children and of children with overweight or obesity and 2) use of an electronic health records -based referral system to enroll children into a structured family centered pediatric weight management program. In addition to assessing key health outcomes and costs, CORD assesses community-based facilitators and barriers to program attendance and program implementation.
- We fund all 50 states and Washington, D.C. to address childhood obesity prevention in Early Care and Education (ECE) settings. We deliver training, tools, and resources to state and local health agencies and help ECE providers promote healthy habits in young children. In addition, we support ECE Learning Collaboratives in 10 states to aid ECE providers in making improvements in nutrition, breastfeeding support, physical activity, and screen time. At the community level, our REACH program uses tailored community-based approaches to implement effective strategies for addressing racial and ethnic health disparities in physical inactivity and poor nutrition. Finally, we also co-lead the Let’s Move Child Care initiative, a voluntary program for child care providers in which over 19,000 ECE providers serving over 1 million children pledged to meet best practices for food, beverages, breastfeeding support, physical activity, and screen time
- We analyze and report on progress being made to address childhood obesity across the nation. CDC released the first-ever ECE State Indicator Report which found that of 25 states that made licensing updates from 2011-2014, all included obesity prevention. Of the 39 states that have ECE quality ratings, 29 include obesity prevention and 42 states offered online professional development for ECE providers covering obesity prevention topics.
Related Links
- Trends in Obesity among Participants Aged 2-4 Years in the Supplemental Nutrition Program for Women, Infants, and Children—United States, 2000-2014 [PDF-490KB]
- DNPAO Early Care and Education State Indicator Report, 2016
- DNPAO State and Local Programs
- DNPAO Childhood Obesity Research Demonstration Project (CORD)
- State of Obesity—WIC Childhood Obesity data
- State of Obesity—Early Child and Education data
- Page last reviewed: November 17, 2016
- Page last updated: November 17, 2016
- Content source: