Occupational Dermatoses
NOTE: This page is archived for historical purposes and is no longer being maintained or updated.
A Program for Physicians
Slides 1 to 5A
Slide 1 - NIOSH Introduction

Slide 2 - Occupational Dermatoses Title
Slide 3 - Statistics
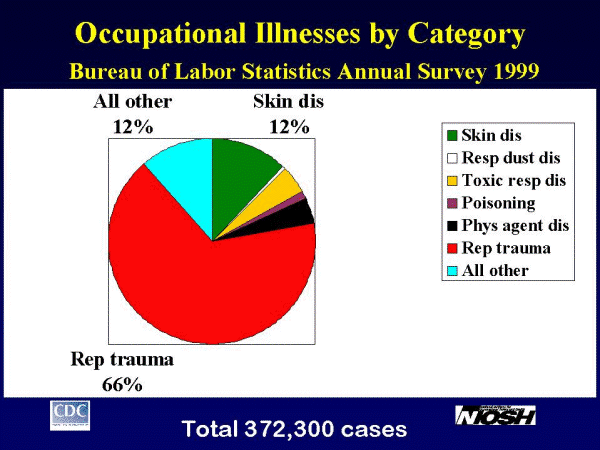
Specific national occupational disease and illness data are available from the U.S. Bureau of Labor Statistics (BLS). The BLS conducts annual surveys of approximately 174,000 employers, selected to represent all private industries in the U.S. The goal is to ascertain the total numbers and incidence rates of occupational injuries and illnesses. The survey results are then projected to estimate the numbers and incidence rates of injuries and illnesses in the American working population. All occupational skin diseases or disorders, including occupational contact dermatitis (OCD), are tabulated in this survey. Information about OCD in particular can be extrapolated from the BLS tabulations (e.g., OCD constitutes 90-95% of all occupational skin diseases; irritant contact dermatitis constitutes approximately 80% of OCD). BLS data are limited in that they exclude self-employed individuals, small farms, and government agencies; depend on misinterpretable definitions of reportable occupational injuries and illnesses; rely to a large extent on employees reporting conditions to the employer; and do not provide information on the etiology of the skin disease. BLS data show that skin diseases accounted for a consistent 30-45% of all cases of occupational illnesses through the mid 1980's. A decline in this rate since 1986 may be partially related to an increase in the diagnosis of disorders associated with repeated trauma. In 1999, of over 372,000 occupational illnesses reported, 12% were skin diseases/disorders, making skin diseases the most common non-trauma related occupational illness.
Slide 4 - Total Cases
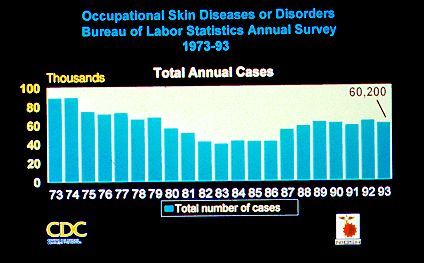
In 1993, BLS data estimated 60,200 cases of occupational skin diseases or disorders in the U.S. workforce. However, because of BLS survey limitations, it has been estimated that the number of actual occupational skin diseases may be on the order of 10-50 times higher than reported by the BLS. This would potentially raise the number of occupational skin disease cases to between one-half and 3 million per year.
Slide 5 - Incidence
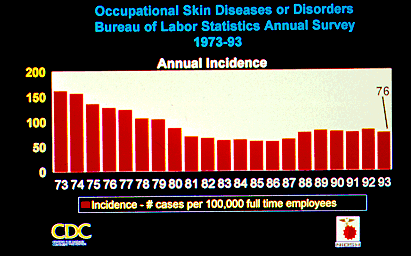
BLS data showed an annual incidence rate of 76 cases per 100,000 workers in 1993. Over the years there have been changes in the number of cases and incidence of occupational skin diseases. The downtrend seen into the mid-1980's may be attributable to several factors: changes in industry and industrial practices, increased awareness and preventive measures, possible under-reporting, under-recognition, and misclassification.
Slide 5A - Changes in Incidence (1993 - 1999)
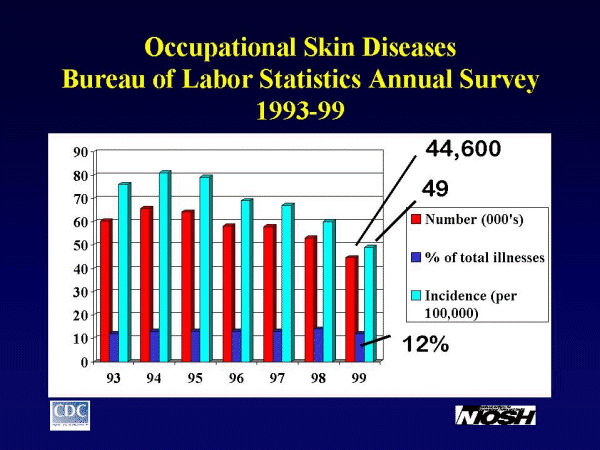
From 1993 to 1999 there have been further changes in the number of cases, incidence and proportion of occupational skin diseases. In 1999 BLS data showed 44,600 total cases of occupational skin diseases/disorders, or an incidence of 49 cases per 100,000. In 1999, 12% of all occupational illnesses reported were skin diseases/disorders.
- Page last reviewed: January 5, 1998 (archived document)
- Content source:
- National Institute for Occupational Safety and Health Health Effects Laboratory Division (HELD)


 ShareCompartir