Mining Publication: Underground Surface Mining Facts - 2008
Original creation date: March 2011
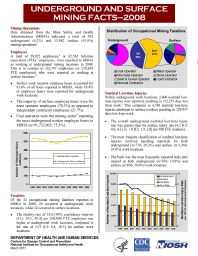
Mining Operations: Data obtained from the Mine Safety and Health Administration (MSHA) indicated a total of 925 underground (6.2%) and 13,982 surface (93 .8%) mining operations. Employees: A total of 59,922 employees, or 62,565 full-time equivalent (FTE) employees, were reported to MSHA as working at underground mining locations in 2008. This is in contrast to 332,797 employees (or 278,054 FTE employees) who were reported as working at surface locations. 1. Surface work location employee hours accounted for 81.6% of all hours reported to MSHA, while 18.4% of employee hours were reported for underground work locations. 2. The majority of surface employee hours were for mine operator employees (78.3%) as opposed to independent contractor employees (21.7%). 3. Coal operators were the mining sector reporting the most underground worker employee hours to MSHA (n=91,732,062; 73.3%). Fatalities: Of the 52 occupational mining fatalities reported to MSHA in 2008, 20 occurred at underground work locations, while 32 occurred at surface locations. 1. The fatality rate of 32 .0 [95% confidence interval (CI): 19.5, 49.4] per 100,000 FTE employees was higher at underground work locations, compared to the rate of 12.9 [CI: 8.8, 18.3] for surface work locations. Nonfatal Lost-time Injuries: Within underground work locations, 2,600 nonfatal lost-time injuries were reported, resulting in 152,273 days lost from work. This compares to 4,748 nonfatal lost-time injuries attributed to surface workers resulting in 229,937 days lost from work. 1. The overall underground nonfatal lost-time injury rate was greater than the surface injury rate (4.2 [CI: 4.0, 4.3] vs. 1.9 [CI: 1.9, 2.0] per 100 FTE workers). 2. The most frequent classification of nonfatal lost-time injuries involved handling materials for both underground (n=734; 28.2%) and surface (n= 1,566; 33.0%) work locations. 3. The back was the most frequently reported body part injured at both underground (n=384; 14.8%) and surface (n=856; 18.0%) work locations.
Authors: NIOSH
Brochure/flyer - March 2011
NIOSHTIC2 Number: 20039158
Pittsburgh, PA: U. S. Department of Health and Human Services, Public Health Service, Centers for Disease Control and Prevention, National Institute for Occupational Safety and Health, DHHS (NIOSH) Publication No. 2011-162, 2011 Mar; :1-2
See Also
- Coal Operator Mining Facts - 2005
- Metal Operator Mining Facts - 2002
- Metal Operator Mining Facts - 2004
- Metal Operator Mining Facts - 2005
- Noncoal Contractor Mining Facts - 2003
- Nonmetal Operator Mining Facts - 2002
- Nonmetal Operator Mining Facts - 2008
- Sand and Gravel Operator Mining Facts - 2006
- Stone Operator Mining Facts - 2003
- Stone Operator Mining Facts - 2005
- Page last reviewed: 10/5/2012
- Page last updated: 10/5/2012
- Content source: National Institute for Occupational Safety and Health, Mining Program


 ShareCompartir
