Coal Industry Sector
On This Page
Introduction
The following maps, graphs, and tables present data for the Coal Industry Sector. The information is organized by Mines, Employees, Fatalities, and Injuries. The Mines section contains information on the locations and number of the active mining operations. The Employees section details the number of mine operator employees by county and the number of employee hours by work location. The Fatalities section describes the number of mine operator and contractor fatalities overall and by work location. The Injuries section presents the number of nonfatal lost-time injuries by county, the number by work location, and the number of injuries by accident class. Data source: Mine Safety and Health Administration (MSHA). See Statistical Methodology for further details. Additional Mining Facts for each commodity are available from 2000 through 2015.
Mines
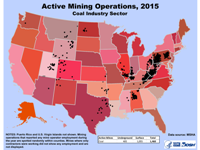 Active Mining Operations, 2015 (Coal Industry Sector): United States map displaying the locations of active mining operations spotted randomly within counties for the coal industry sector in 2015. Active mines are mining operations that reported mine operator employment during the year. Of the 1,460 coal mines, 405 were underground, and 1,055 were surface mines. Mines at which only contractors were working did not show any employment and are not displayed.
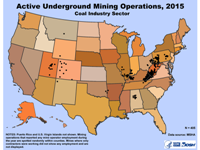 Active Underground Mining Operations, 2015 (Coal Industry Sector): United States map displaying the locations of active underground mining operations spotted randomly within counties for the coal industry sector in 2015. Active mines are mining operations that reported mine operator employment during the year. There were 405 underground coal mines. Mines at which only contractors were working did not show any employment and are not displayed.
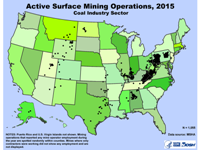 Active Surface Mining Operations, 2015 (Coal Industry Sector): United States map displaying the locations of active surface mining operations spotted randomly within counties for the coal industry sector in 2015. Active mines are mining operations that reported mine operator employment during the year. There were 1,055 surface coal mines. Mines at which only contractors were working did not show any employment and are not displayed.
Employees
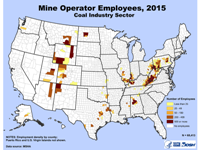 Mine Operator Employees, 2015 (Coal Industry Sector): Map of the United States displaying employment density by county for the 68,413 mine operator employees in the coal industry sector during 2015. A graduated color ramp is used to represent densities of less than 25 employees, 25 to 49 employees, 50 to 199 employees, 200 to 499 employees, and 500 or more employees, respectively.
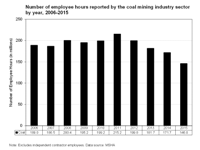 Number of Employee Hours Reported for the Coal Mining Industry Sector by Year, 2006-2015: Graph displays the number of mine operator employee hours reported for the coal mining industry over a 10-year period. Employee hours showed an increase from 189.0 million in 2006 to a high of 215.2 million hours in 2011. The hours then declined to 146.0 million in 2015.
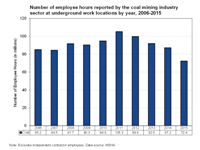 Number of Employee Hours Reported by the Coal Mining Industry Sector at Underground Work Locations by Year, 2006-2015: Graph displays the number of mine operator underground employee hours reported for the coal mining industry over a 10-year period. The employee hours increased over the period from 85.2 million in 2006 to a high of 105.3 in 2011. The hours then declined to 72.4 million in 2015.
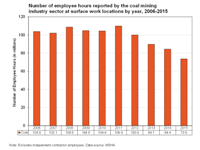 Number of Employee Hours Reported by the Coal Mining Industry Sector at Surface Work Locations by Year, 2006-2015ns by Year, 2006-2015: Graph displays the number of mine operator employee hours at surface work locations reported for the coal mining industry over a 10-year period. The employee hours varied over the period from 103.8 million in 2006 to a high of 109.9 in 2011. The hours then declined to 73.6 million hours reported in 2015.
Fatalities
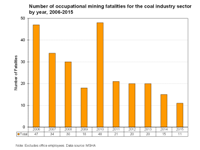 Number of Occupational Mining Fatalities for the Coal Industry Sector by Year, 2006-2015: Graph displaying the number of occupational mining fatalities, excluding office employees, over a 10-year period for the coal industry sector. The numbers vary by year with the highest numbers occurring in 2006 and 2010 when there were 47 and 48 fatalities, respectively. The lowest number during the period was 11 fatalities occurring in 2015.
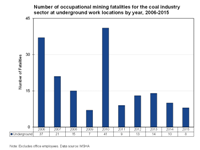 Number of Occupational Mining Fatalities for the Coal Industry Sector at Underground Work Locations by Year, 2006-2015: Graph displaying the number of occupational mining fatalities, excluding office employees, occurring at underground work locations over a 10-year period for the coal industry sector. The numbers vary by year with the highest number reported in 2010 when 41 fatalities occurred. The lowest number during the period was seven fatalities reported in 2009.
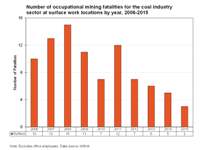 Number of Occupational Mining Fatalities for the Coal Industry Sector at Surface Work Locations by Year, 2006-2015: Graph displaying the number of occupational mining fatalities, excluding office employees, occurring at surface work locations over a 10-year period for the coal industry sector. The numbers vary by year with the highest number of 15 fatalities reported in 2008 and the lowest number of three fatalities reported in 2015.
Injuries
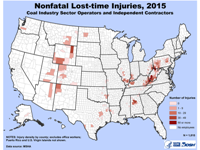 Nonfatal Lost-time Injuries, 2015 (Coal Industry Sector Operators and Contractors): Map of the United States displaying nonfatal lost-time injury density by county for 1,815 coal industry sector operator and contractor injuries during 2015. Office workers are excluded. A graduated color ramp is used to symbolize densities of zero, 1 to 9, 10 to 29, 30 to 49, and 50 or more injuries, respectively.
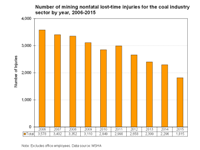 Number of Mining Nonfatal Lost-time Injuries for the Coal Industry Sector by Year, 2006-2015: Graph displaying the number of mining nonfatal lost-time injuries for the coal industry sector, excluding office employees, from 2006 through 2015. The number of injuries has declined over the period from a high of 3,578 in 2006, to a low of 1,815 in 2015.
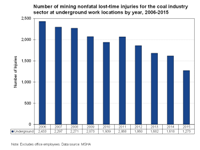 Number of Mining Nonfatal Lost-time Injuries for the Coal Industry Sector at Underground Work Locations by Year, 2006-2015: Graph displaying the number of mining nonfatal lost-time injuries for the coal industry sector at underground work locations, excluding office employees, from 2006 through 2015. The number of injuries declined over the period from a high of 2,433 in 2006 to a low of 1,273 in 2015.
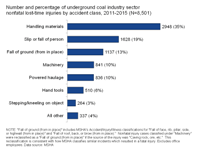 Number and Percentage of Underground Coal Industry Sector Nonfatal Lost-time Injuries by Accident Class, 2011-2015: Graph displays the distribution of nonfatal lost-time injuries in the coal industry by accident class for underground mining locations for the period from 2011 through 2015. Excluding office employees, there were a total of 8,501 lost-time injuries. "Handling materials" accounted for 35%, "Slip or fall of person" made up 19%, and "Fall of ground (from in place)" saw 13% of the nonfatal lost-time injuries. Note that "Fall of ground (from in place)" includes MSHA’s Accident/Injury/Illness Classifications for “Fall of face, rib, pillar, side, or highwall from in place” and “Fall of roof, back, or brow from in place.” Nonfatal injury cases classified under machinery were reclassified as a fall of ground (from in place) if the source of the injury was caving rock, ore, etc. This reclassification is consistent with how MSHA classifies similar incidents which resulted in a fatal injury. "Machinery" and "Powered haulage" each accounted for 10% of the nonfatal lost-time injuries. "Hand tools" saw 6%, "Stepping/kneeling on object" had 3%, and the "All other" category made up 4% of the nonfatal lost-time injuries during the 5-year period. Note that the sum of percentages may not equal 100 due to independent rounding.
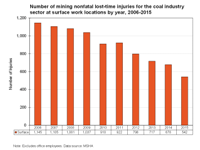 Number of Mining Nonfatal Lost-time Injuries for the Coal Industry Sector at Surface Work Locations by Year, 2006-2015: Graph displaying the number of mining nonfatal lost-time injuries for the coal industry sector at surface work locations, excluding office employees, from 2006 through 2015. The number of injuries declined over the period from a high of 1,145 in 2006 to a low of 542 in 2015.
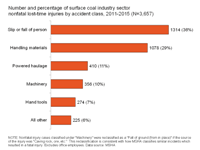 Number and Percentage of Surface Coal Industry Sector Nonfatal Lost-time Injuries by Accident Class, 2011-2015: Graph displays the distribution of nonfatal lost-time injuries in the coal industry by accident class for surface mining locations for the period from 2011 through 2015. Excluding office employees, there were a total of 3,657 lost-time injuries. "Slip or fall of person" accounted for 36% and "Handling materials" 29% of the nonfatal lost-time injuries. "Powered haulage" made up 11% and "Machinery" accounted for 10% of the nonfatal lost-time injuries. Note that nonfatal injury cases classified under machinery were reclassified as a fall of ground (from in place) if the source of the injury was caving rock, ore, etc. This reclassification is consistent with how MSHA classifies similar incidents which resulted in a fatal injury. "Hand tools" made up 7% and the "All other" category saw 6% of the nonfatal lost-time injuries during the 5-year period. Note that the sum of percentages may not equal 100 due to independent rounding.
See Also
- Analysis of Mine Fires for All U.S. Underground and Surface Coal Mining Categories: 1990-1999
- Independent Contractors
- Metal and Nonmetal Industry Sector
- Mining Fact Sheets
- Mining Facts - 2015
- Refuge Alternatives in Underground Coal Mines
- Safe and Economical Inerting of Sealed Mine Areas
- SPONCOM - A Computer Program for the Prediction of the Spontaneous Combustion Potential of an Underground Coal Mine
- Statistical Methodology
- Statistics: Coal Operators
- Stone and Sand & Gravel Industry Sector
- Technology News 535 - NIOSH Releases New Educational Video: Escape from Farmington No. 9: An Oral History
- Technology News 545 - NIOSH Updates Spontaneous Combustion Assessment Software
- Ultra-Low Frequency Through-the-Earth Communication Technology
- Wireless Mesh Mine Communication System
- Page last reviewed: 4/11/2017
- Page last updated: 4/11/2017
- Content source: National Institute for Occupational Safety and Health, Mining Program


 ShareCompartir