Statistics: All Mining
On This Page
Introduction
The following maps, graphs, and tables present data for All Mining. The information is organized by Mines, Employees, Fatalities, and Injuries. The Mines section contains information on the number and location of the mining operations. The Employees section details the number of employees and the number of employee hours. The Fatalities section describes the number and rate of fatalities, the number and rate by work locations, and the number of fatalities by accident class. The Injuries section presents the number and rate of nonfatal lost-time injuries, the number and rate by work locations, and the number of injuries by accident class. Data source: Mine Safety and Health Administration (MSHA). See Statistical Methodology for further details. Additional Mining Facts for each commodity are available from 2000 through 2015.
Mines
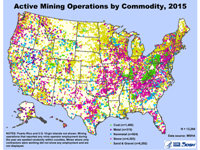 Active Mining Operations by Commodity, 2015: United States map displaying symbols spotted randomly within counties for the locations of active mining operations by commodity. In 2015, there were a total of 13,294 mining operations that reported mine operator employment. The commodity breakdown was 1,460 coal, 315 metal, 924 nonmetal, 4,303 stone, and 6,292 sand & gravel mines. Mines at which only contractors were working did not show any employment and are not displayed.
Number of Active Mines by Commodity and Year, 2006-2015: Graph displays the number of active mines by commodity for a 10-year period. Active mines are those mines that reported any mine operator employee hours during the year. The year with the highest number of active mining operations was 2008 when there were 14,907 active mines. Overall, there were 13,294 mines in 2015. The commodity breakdown was 1,460 coal, 315 metal, 924 nonmetal, 4,303 stone, and 6,292 sand & gravel mines.
Locations of Active Underground Mining Operations, 2015: United States map displaying the locations of 657 active underground mining operations spotted randomly within counties. Active mines are those that report any operator employment during the year. Mines at which only contractors were working did not show any employment and are not displayed.
Locations of Active Surface Mining Operations, 2015: United States map displaying the locations of 12,637 active surface mining operations spotted randomly within counties. Active mines are those that report operator employment during the year. Mines at which only contractors were working did not show any employment and are not displayed.
Employees
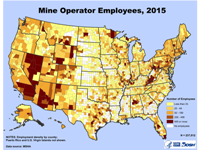 Mine Operator Employees, 2015: United States map displaying employment density by county of the 237,812 mine operator employees in 2015. A graduated color ramp is used to symbolize densities of less than 25 employees, 25 to 49 employees, 50 to 199 employees, 200 to 499 employees, and 500 or more employees.
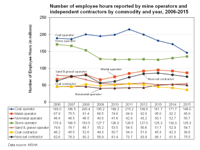 Number of Employee Hours Reported by Mine Operators and Independent Contractors by Commodity and Year, 2006-2015: Graph displays the number of employee hours for mine operator and independent contractors by commodity over a 10-year period from 2006 through 2015. Over the period, coal operators reported the most number of employee hours with a high of 215.2 million hours reported for 2011. From this point, the employee hours for coal operators declined to 146.0 million in 2015. The next highest sector was stone operators with 135.3 million hours reported in 2015. Metal operator employment increased from 67.9 in 2006 to a high of 95.0 million hours in 2013. Sand & gravel operator employee hours declined from a high of 79.6 in 2006 to a low of 51.7 in 2013. Employee hours over the period for nonmetal operators varied between 40.8 in 2009 and 52.7 million in 2014. Employment for coal contractors varied from 54.3 million in 2011 to a low of 36.6 in 2015. Noncoal contractors showed an increase over the period from 62.6 million hours in 2006 to 86.1 million hours in 2013.
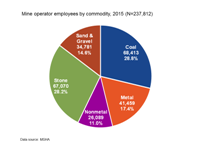 Mine Operator Employees by Commodity, 2015: Chart displays by commodity the number and percentages of mine operator employees in 2015. Of the 237,812 employees reported, coal had 68,413 employees (28.8%), followed by stone with 67,070 (28.2%), metal with 41,459 (17.4%), sand & gravel with 34,781 (14.6%), and nonmetal with 26,089 employees (11.0%).
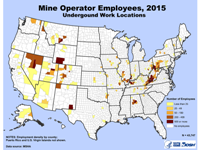 Mine Operator Employees, 2015 (Underground Work Locations): United States map displaying employment density by county for the 43,747 mine operator employees working at underground locations in 2015. A graduated color ramp is used to symbolize densities of less than 25 employees, 25 to 49 employees, 50 to 199 employees, 200 to 499 employees, and 500 or more employees.
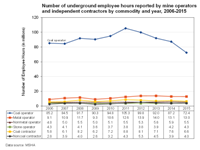 Number of Underground Employee Hours Reported by Mine Operators and Independent Contractors by Commodity and Year, 2006-2015: Graph displays the number of underground employee hours reported by commodity from 2006 through 2015. Coal operators reported most number of employee hours over the period varying from 85.2 million hours in 2006, to a high of 105.3 in 2011, and then a steady decline to 72.4 in 2015. Metal operators ranged from a low of 9.1 million hours in 2006 to 13.1 million hours in 2014, with employment declining to 13.0 in 2015. Over the period, nonmetal operators varied from 4.8 to 5.9 million employee hours and stone operator employment ranged from 3.6 to 4.3 million hours. Employment for coal contractors ranged from a low of 5.8 million hours in 2006 to a high of 8.8 in 2011, with employment declining to 6.6 in 2015. The noncoal contractor employment varied over the period from 2.8 to 5.3 million hours.
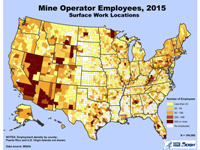 Mine Operator Employees, 2015 (Surface Work Locations): United States map displaying employment density by county for the 194,065 mine operator employees working at surface work locations in 2015. A graduated color ramp is used to symbolize densities of less than 25 employees, 25 to 49 employees, 50 to 199 employees, 200 to 499 employees, and 500 or more employees.
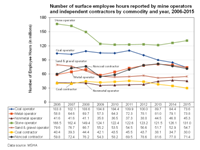 Number of Surface Employee Hours Reported by Mine Operators and Independent Contractors by Commodity and Year, 2006-2015: Graph displays the number of surface employee hours reported by mine operators and independent contractors by commodity for 2006 through 2015. Stone operators had the most number of employee hours over the period with a high of 166.5 million reported for 2006, decreasing to 121.5 million hours in 2013. Coal operator employee hours in 2006 were 103.8 million and climbed to a high of 109.9 in 2011 before declining to 73.6 million hours in 2015. Metal operator employee hours ranged from 58.8 in 2006 to 81.0 in 2013, before decreasing to 73.8 million in 2015. During the period, nonmetal operators ranged from a low of 35.8 in 2009 to a high of 46.8 million hours in 2014. Employment for coal contractors ranged from a high of 45.5 million hours in 2011 to a low of 30.0 in 2015. Noncoal contractors showed an increase from 59.8 in 2006 to 81.6 million hours in 2013. There were 71.4 million employee hours reported for noncoal contractors in 2015.
Fatalities
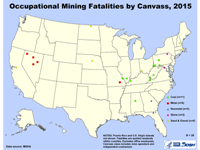 Occupational Mining Fatalities by Canvass, 2015: United States map displaying locations of occupational mining fatalities spotted randomly within counties. There were a total of 26 mining fatalities reported in 2015 (coal=11, metal=5, nonmetal=2, stone=2, sand & gravel=6). The canvass class includes mine operators and independent contractors. Office employees are excluded.
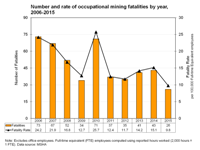 Number and Rate of Occupational Mining Fatalities by Year, 2006-2015: Graph displays the number and rate of occupational mining fatalities, excluding office employees, from 2006 through 2015. Full-time equivalent (FTE) employees are based on 2,000 employee hours worked per year. The numbers and rates vary by year with the highest rate of fatalities occurring in 2006 when 73 fatalities occurred at a rate of 24.2 fatalities per 100,000 FTEs. The lowest number was in 2015 when 26 fatalities occurred. The fatality rate was the lowest in 2015 with 9.8 fatalities per 100,000 FTEs.
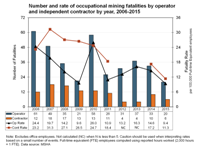 Number and Rate of Occupational Mining Fatalities by Operator and Independent Contractor by Year, 2006-2015: Graph displays the number and rate of occupational mining fatalities, excluding office employees, from 2006 through 2015. Full-time equivalent (FTE) employees are based on 2,000 employee hours worked per year. The numbers and rates vary by year with the highest number occurring in 2006 when mine operators reported 61 fatalities occurring at a rate of 24.4 fatalities per 100,000 FTEs. The mine operator fatality rate was the lowest in 2015 (n=20) with 9.4 fatalities per 100,000 FTEs. The highest number of 18 independent contractor fatalities occurred in 2007, and the lowest number of 4 independent contractor fatalities occurred in both 2012 and 2013.
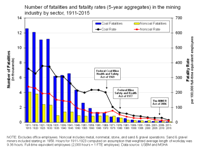 Number of Fatalities and Fatality Rate (5-year aggregates) in the Mining Industry by Commodity, 1911-2015: Graph displays the number of fatalities and fatality rates in 5-year aggregates in the mining industry by coal and noncoal from 1911 through 2015, excluding office employees. Noncoal includes metal, nonmetal, stone, and sand & gravel operations. Sand and gravel miners were included starting in 1958. Full-time equivalent (FTE) employees are based on 2,000 employee hours worked per year. The fatality rate is based on 100,000 full time equivalent employees. The coal fatality rate shows a rapid decline in fatalities after the passage of the Federal Coal Mine Health and Safety Act of 1969. The Federal Mine Safety and Health Act of 1977 consolidated federal mine regulations for coal and metal/nonmetal under MSHA. The Mine Improvement and New Emergency Response Act of 2006 (MINER Act) amended the Federal Mine Safety and Health Act of 1977.
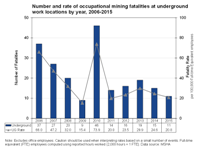 Number and Rate of Occupational Mining Fatalities at Underground Work Locations by Year, 2006-2015: Graph displays the distribution of occupational fatalities by accident class for underground mining locations for the period 2011 through 2015. Full-time equivalent (FTE) employees are based on 2,000 employee hours worked per year. The numbers and rates vary by year with the highest rate of fatalities occurring in 2010 when 46 occurred at a rate of 73.9 fatalities per 100,000 FTEs. The fatality rate was the lowest in 2009 when there were 9 fatalities occurring at a rate of 15.4 per 100,000 FTEs.
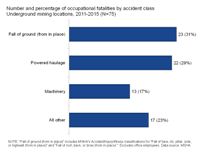 Occupational Fatalities by Accident Class at Underground Mining Locations, 2011-2015: Graph displays the distribution of occupational fatalities by accident class for underground mining locations for the period 2011 through 2015. There were 75 underground fatalities, excluding office employees. The largest category during the period was “Fall of ground (from in place)” with 31% of the underground fatalities, which includes MSHA’s Accident/Injury/Illness Classifications for “Fall of face, rib, pillar, side, or highwall from in place” and “Fall of roof, back, or brow from in place”. "Powered haulage" caused 29%, "Machinery" attributed to 17%, and the "All other" category comprised 23% of the underground fatalities.
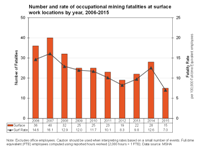 Number and Rate of Occupational Mining Fatalities at Surface Work Locations by Year, 2006-2015: Graph displays the number and rate of occupational mining fatalities, excluding office employees, from 2006 through 2015. Full-time equivalent (FTE) employees are based on 2,000 employee hours worked per year. The fatality numbers and rates have declined from a high of 40 fatalities in 2007 with a rate of 16.1 per 100,000 FTEs, to a low of 15 fatalities in 2015 with a rate of 7.0 per 100,000 FTEs.
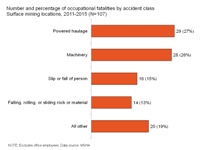 Occupational Fatalities by Accident Class at Surface Mining Locations, 2011-2015: Graph displays the distribution of occupational fatalities by accident class for surface mining locations for the period 2011 through 2015. Excluding office employees, there were a total of 107 surface fatalities. "Powered haulage" had 27% of the fatalities and "Machinery" accounted for 26%. "Slip or fall of person" had 15% and "Falling, rolling, or sliding rock or material" had 13% of the surface mining fatalities. The "All other" category accounted for 19% of the surface fatalities. Sum of percentages may not equal 100 due to independent rounding.
Injuries
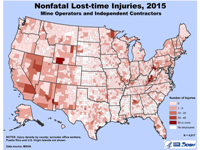 Nonfatal Lost-time Injuries, 2015 (Mine Operators and Independent Contractors): Map of the United States displaying nonfatal lost-time injury density by county for mine operator and contractor injuries during 2015. Office workers are excluded. A graduated color ramp is used to symbolize densities of zero, 1 to 9, 10 to 29, 30 to 49, and 50 or more injuries. The total number of nonfatal lost-time injuries in 2015 was 4,517.
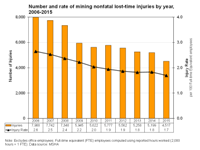 Number and Rate of Mining Nonfatal Lost-time Injuries by Year, 2006-2015: Graph displays the number and rate of mining nonfatal lost-time injuries, excluding office employees, from 2006 through 2015. Full-time equivalent (FTE) employees are based on 2,000 employee hours worked per year. The rate has declined steadily over the period from 2.6 per 100 FTEs in 2006 to 1.7 per 100 FTE in 2015. The number of injuries has also declined from 7,988 to 4,517 over the period.
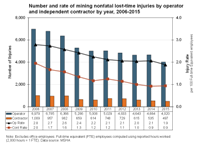 Number and Rate of Mining Nonfatal Lost-time Injuries by Operator and Independent Contractor by Year, 2006-2015: Graph displays the number and rate of mining nonfatal lost-time injuries, excluding office employees, by mine operators and independent contractors by year from 2006 through 2015. Full-time equivalent (FTE) employees equal 2,000 hours worked per year. The injury numbers and rates for both operators and contractors have declined over the period. There were 6,979 nonfatal lost-time injuries in 2006 for operators with an injury rate of 2.8 per 100 FTEs. By 2015, the operator injuries decreased to 4,020 at a rate of 1.9 per 100 FTEs. The number of independent contractor injuries was the highest in 2006 with 1,009 injuries, and the lowest year was 2015 with 497 injuries. The rates for contractors declined from 2.0 per 100 FTEs in 2006 to 0.9 per 100 FTEs in 2015.
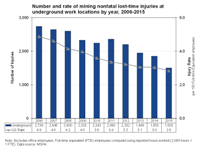 Number and Rate of Mining Nonfatal Lost-time Injuries at Underground Work Locations by Year, 2006-2015: Graph displays the number of mining nonfatal lost-time injuries, excluding office employees, at underground work locations from 2006 through 2015. Rates are based on full-time equivalent (FTE) employees which equal 2,000 hours worked per year. The nonfatal lost-time injury rate has declined from 4.9 per 100 FTEs in 2006 to 2.8 per 100 FTEs in 2015. In 2006, the number of nonfatal lost-time injuries reported was 2,739, declining to 1,503 nonfatal lost-time injuries in 2015.
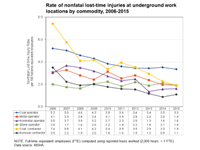 Rate of Nonfatal Lost-time Injuries at Underground Work Locations by Commodity, 2006-2015: Graph displays the rate of nonfatal lost-time injuries per 100 full-time equivalent employees at underground work locations by commodity from 2006 through 2015. Note that a full-time equivalent employee (FTE) is computed using 2,000 hours worked to equal 1 FTE. Data are displayed for coal operators, metal operators, nonmetal operators, stone operators, coal contractors and noncoal contractors. Coal contractors, which held the highest overall fatal rate, have shown the most dramatic decline over the period from a high rate of 7.4 per 100 FTEs in 2006 to a low of 1.9 per 100 FTEs in 2015. All commodity fatal rates have shown downward trends over the 10-year period.
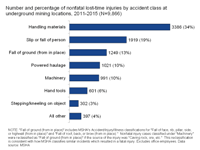 Nonfatal Lost-time Injuries by Accident Class for Underground Mining Locations, 2011-2015: Graph displays the distribution of nonfatal lost-time injuries by accident class for underground mining locations for the period from 2011 through 2015. Excluding office employees, there were a total of 9,866 lost-time injuries. The percentages were as follows: "Handling materials" 34%, "Slip or fall of person" 19%, "Fall of ground (from in place)" which includes MSHA’s Accident/Injury/Illness Classifications for “Fall of face, rib, pillar, side, or highwall from in place” and “Fall of roof, back, or brow from in place,“ had 13% of the nonfatal lost-time injuries reported. Note that nonfatal injury cases classified under machinery were reclassified as a fall of ground (from in place) if the source of the injury was caving rock, ore, etc. This reclassification is consistent with how MSHA classifies similar incidents which resulted in a fatal injury. “Powered haulage” and "Machinery" both accounted for 10% of the lost-time injuries. "Hand tools" saw 6%, “Stepping/kneeling on object accounted for 3%, and the "All other" category ended with 4% of the nonfatal lost-time injuries during the 5-year period. Note that the sum of percentages may not equal 100 due to independent rounding.
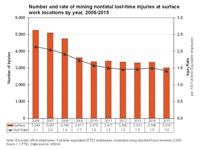 Number and Rate of Mining Nonfatal Lost-time Injuries at Surface Work Locations by Year, 2006-2015: Graph displays the number of mining nonfatal lost-time injuries, excluding office employees, at surface work locations from 2006 through 2015. Rates are based on full-time equivalent (FTE) employees which equal 2,000 hours worked per year. The nonfatal lost-time injury rate has declined over the period from 2.1 per 100 FTEs to 1.4 per 100 FTEs. During the period, the highest number of 5,249 nonfatal lost-time injuries occurred in 2006 and the lowest number of 3,014 was reported in 2015.
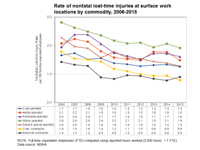 Rate of Nonfatal Lost-time Injuries at Surface Work Locations by Commodity, 2006-2015: Graph displays the rate of nonfatal lost-time injuries per 100 full-time equivalent employees at surface work locations by commodity from 2006 through 2015. Note that a full-time equivalent employee (FTE) is computed using 2,000 hours worked to equal 1 FTE. Data are displayed for coal operators, metal operators, nonmetal operators, stone operators, sand & gravel operators, coal contractors and noncoal contractors. Stone operators saw the highest nonfatal injury rates ranging from 2.8 per 100 FTEs in 2006 declining to 1.9 per 100 FTEs in 2015, and noncoal contractor rates saw the lowest nonfatal injury rates, 1.4 per 100 FTEs in 2006 declining to 0.9 per 100 FTEs in 2015.
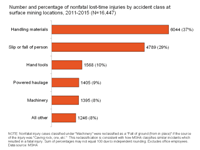 Lost-time Injuries by Accident Class for Surface Mining Locations, 2011-2015: Graph displays the distribution of nonfatal lost-time injuries by accident class for surface mining locations for the period from 2011 through 2015. Excluding office employees, there were a total of 16,447 lost-time injuries. "Handling materials" had 37%, "Slip or fall of person" had 29%, and "Hand tools" accounted for 10% of the nonfatal lost-time injuries. "Powered haulage" had 9% and "Machinery" accounted for 8% of the nonfatal lost-time injury cases. Note that cases classified under machinery were reclassified as a fall of ground (from in place) if the source of the injury was caving rock, ore, etc. This reclassification is consistent with how MSHA classifies similar incidents which resulted in a fatal injury. The "All other" category saw 8% of the nonfatal lost-time injuries during the 5-year period. Note that the sum of percentages may not equal 100 due to independent rounding.
- Page last reviewed: 2/27/2017
- Page last updated: 3/7/2017
- Content source: National Institute for Occupational Safety and Health, Mining Program


 ShareCompartir