

World TB Day
 ShareCompartir
March 23, 2017 – Latest analysis of tuberculosis trends in US indicates progress is slow
In advance of World TB Day, March 24, CDC has released preliminary national TB surveillance data for 2016. While TB remains under control in the United States, our progress is not enough to eliminate TB in the near future, or even this century. Accelerating progress toward TB elimination will require an intensified dual approach.
Resources
- Statement: World TB Day Statement from Dr. Philip LoBue, Director, CDC’S Division of TB Elimination
- Fact Sheet: TB in the United States: A Snapshot
Graphics: Preliminary 2016 U.S. TB Surveillance Data
The following images and graphics highlight major findings from CDC’s analysis. These high-resolution, public domain images are ready to download and print in your publication. Click on a graphic to see it in high-resolution.
These images are in the public domain and are thus free of any copyright restrictions. As a matter of courtesy, we ask that the content provider be credited and notified of any public or private usage of an image.
Illustration of Mycobacterium tuberculosis

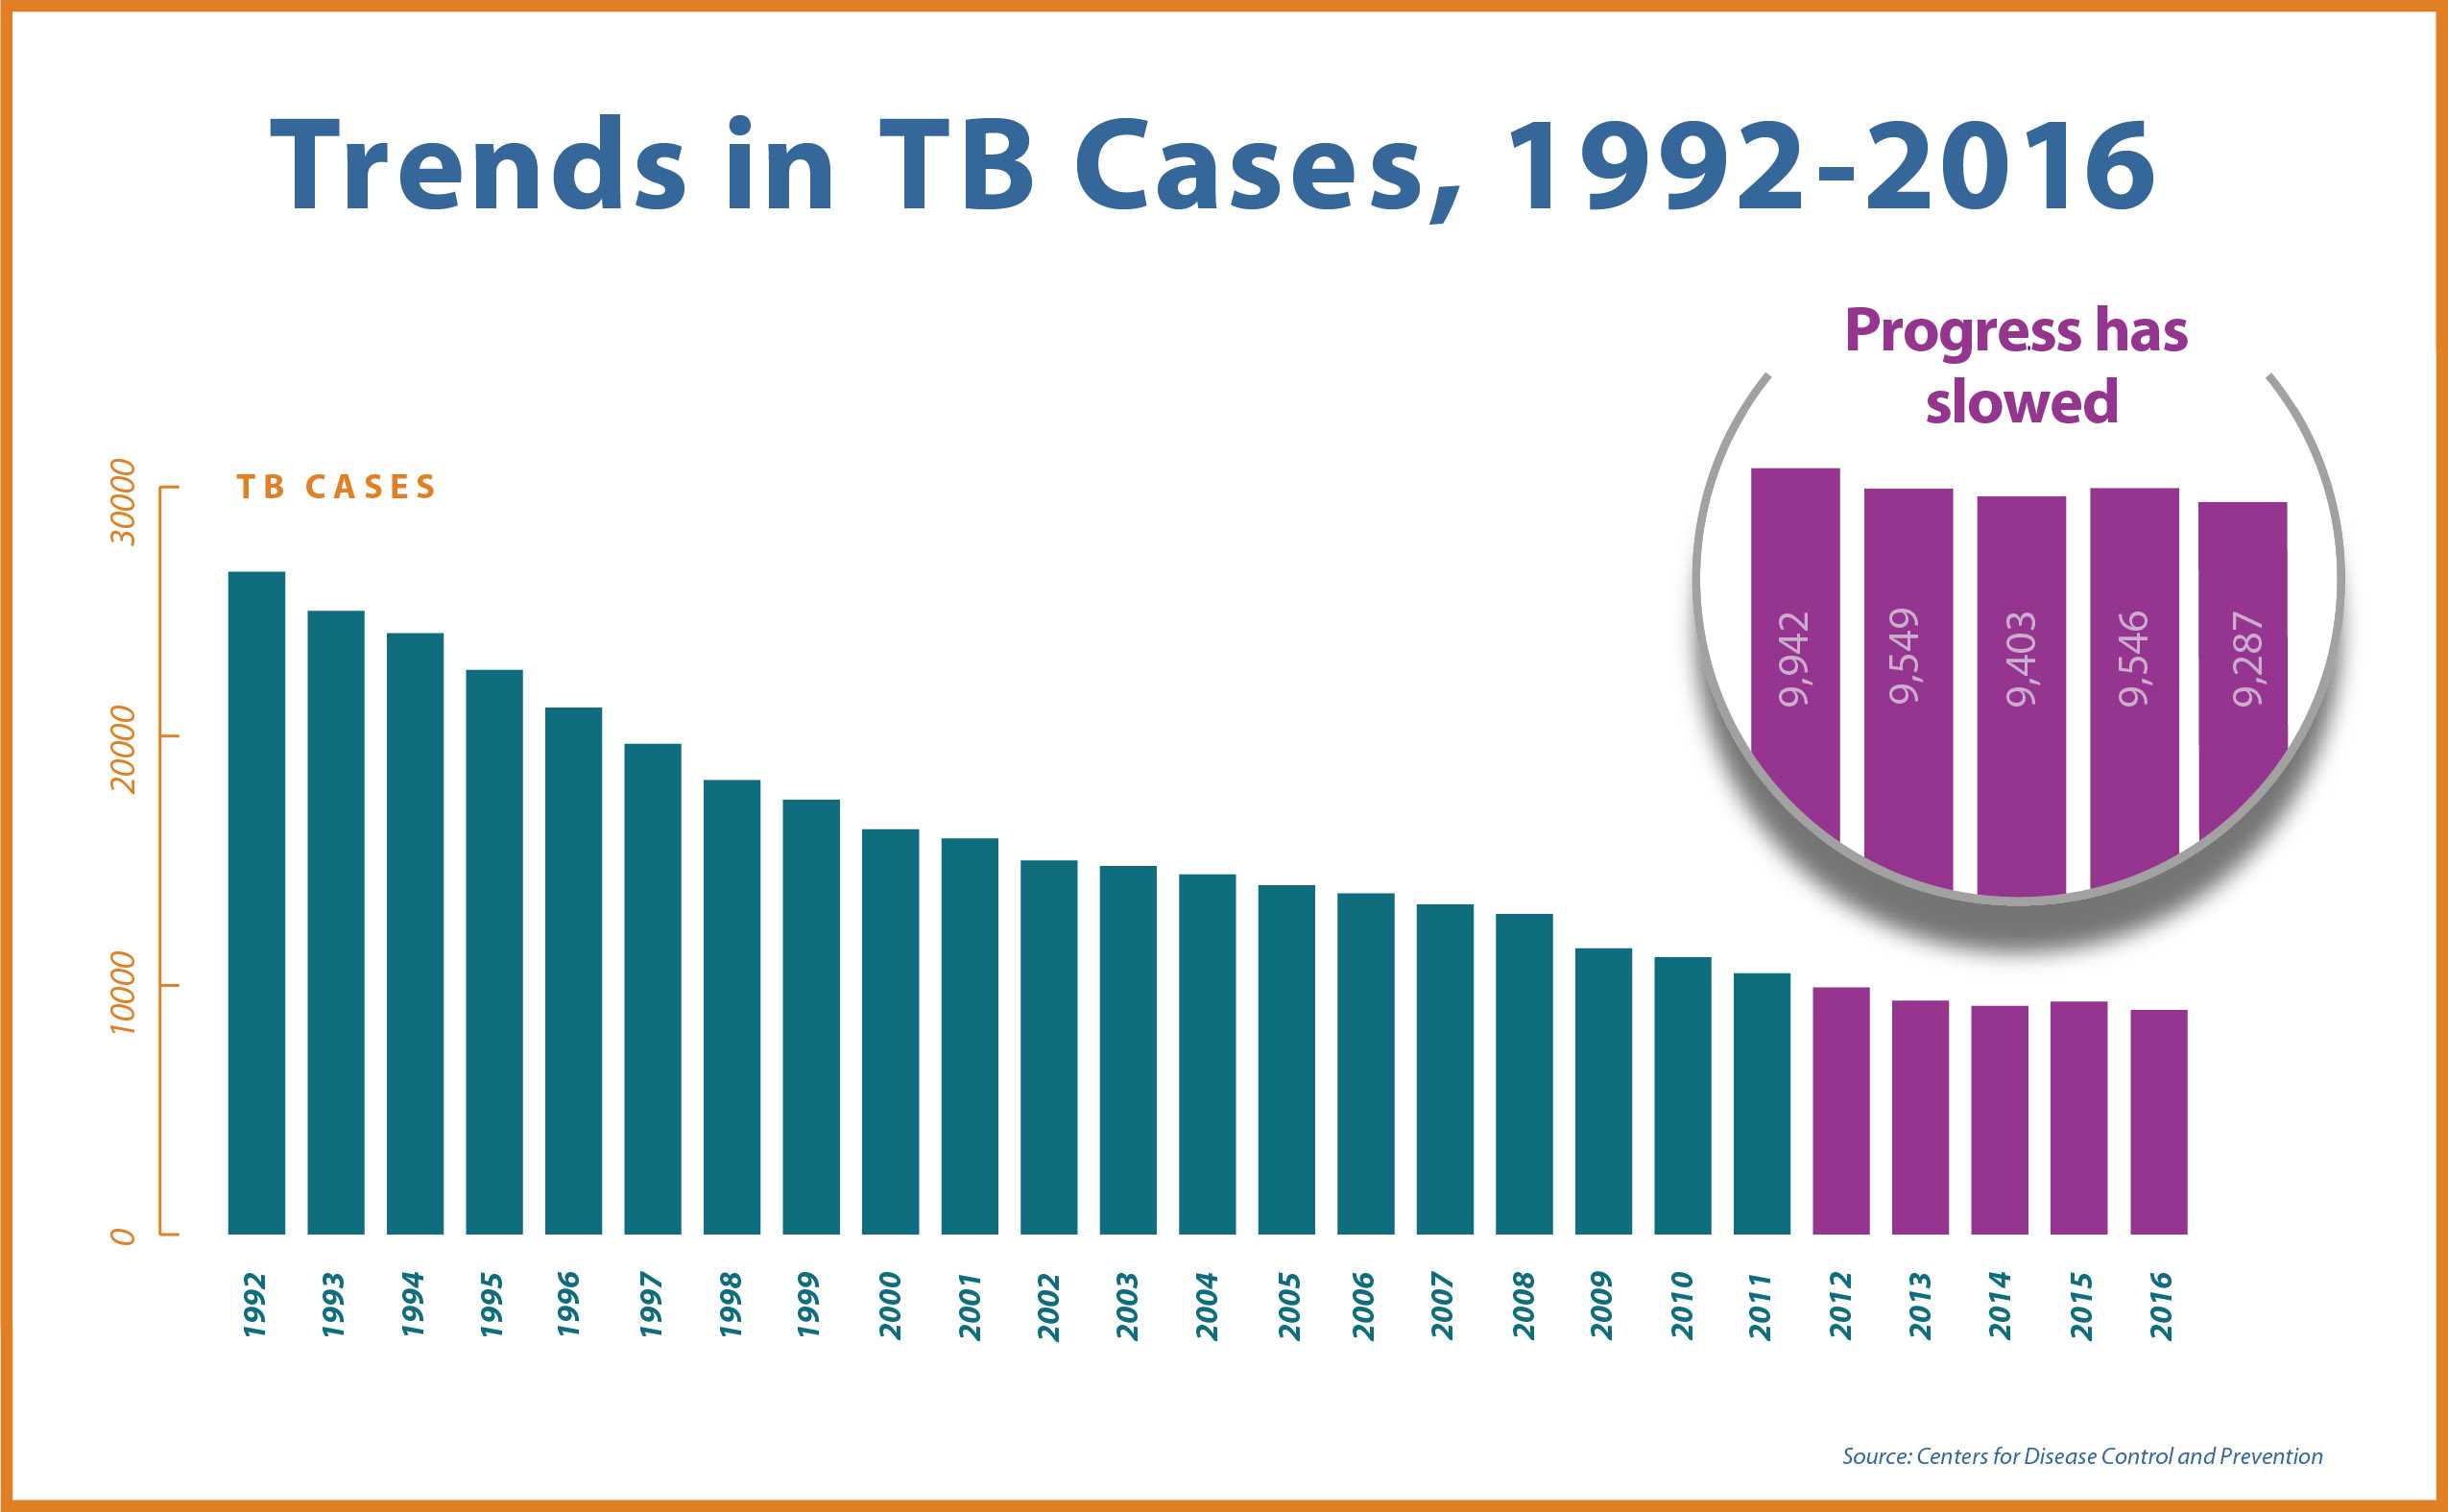
Trends in TB Cases, 1992- 2016
View High Resolution Version
A total of 9,287 TB cases were reported in the United States in 2016 according to preliminary data from the CDC National TB Surveillance System.
TB remains under control in the United States, but progress has slowed in recent years.
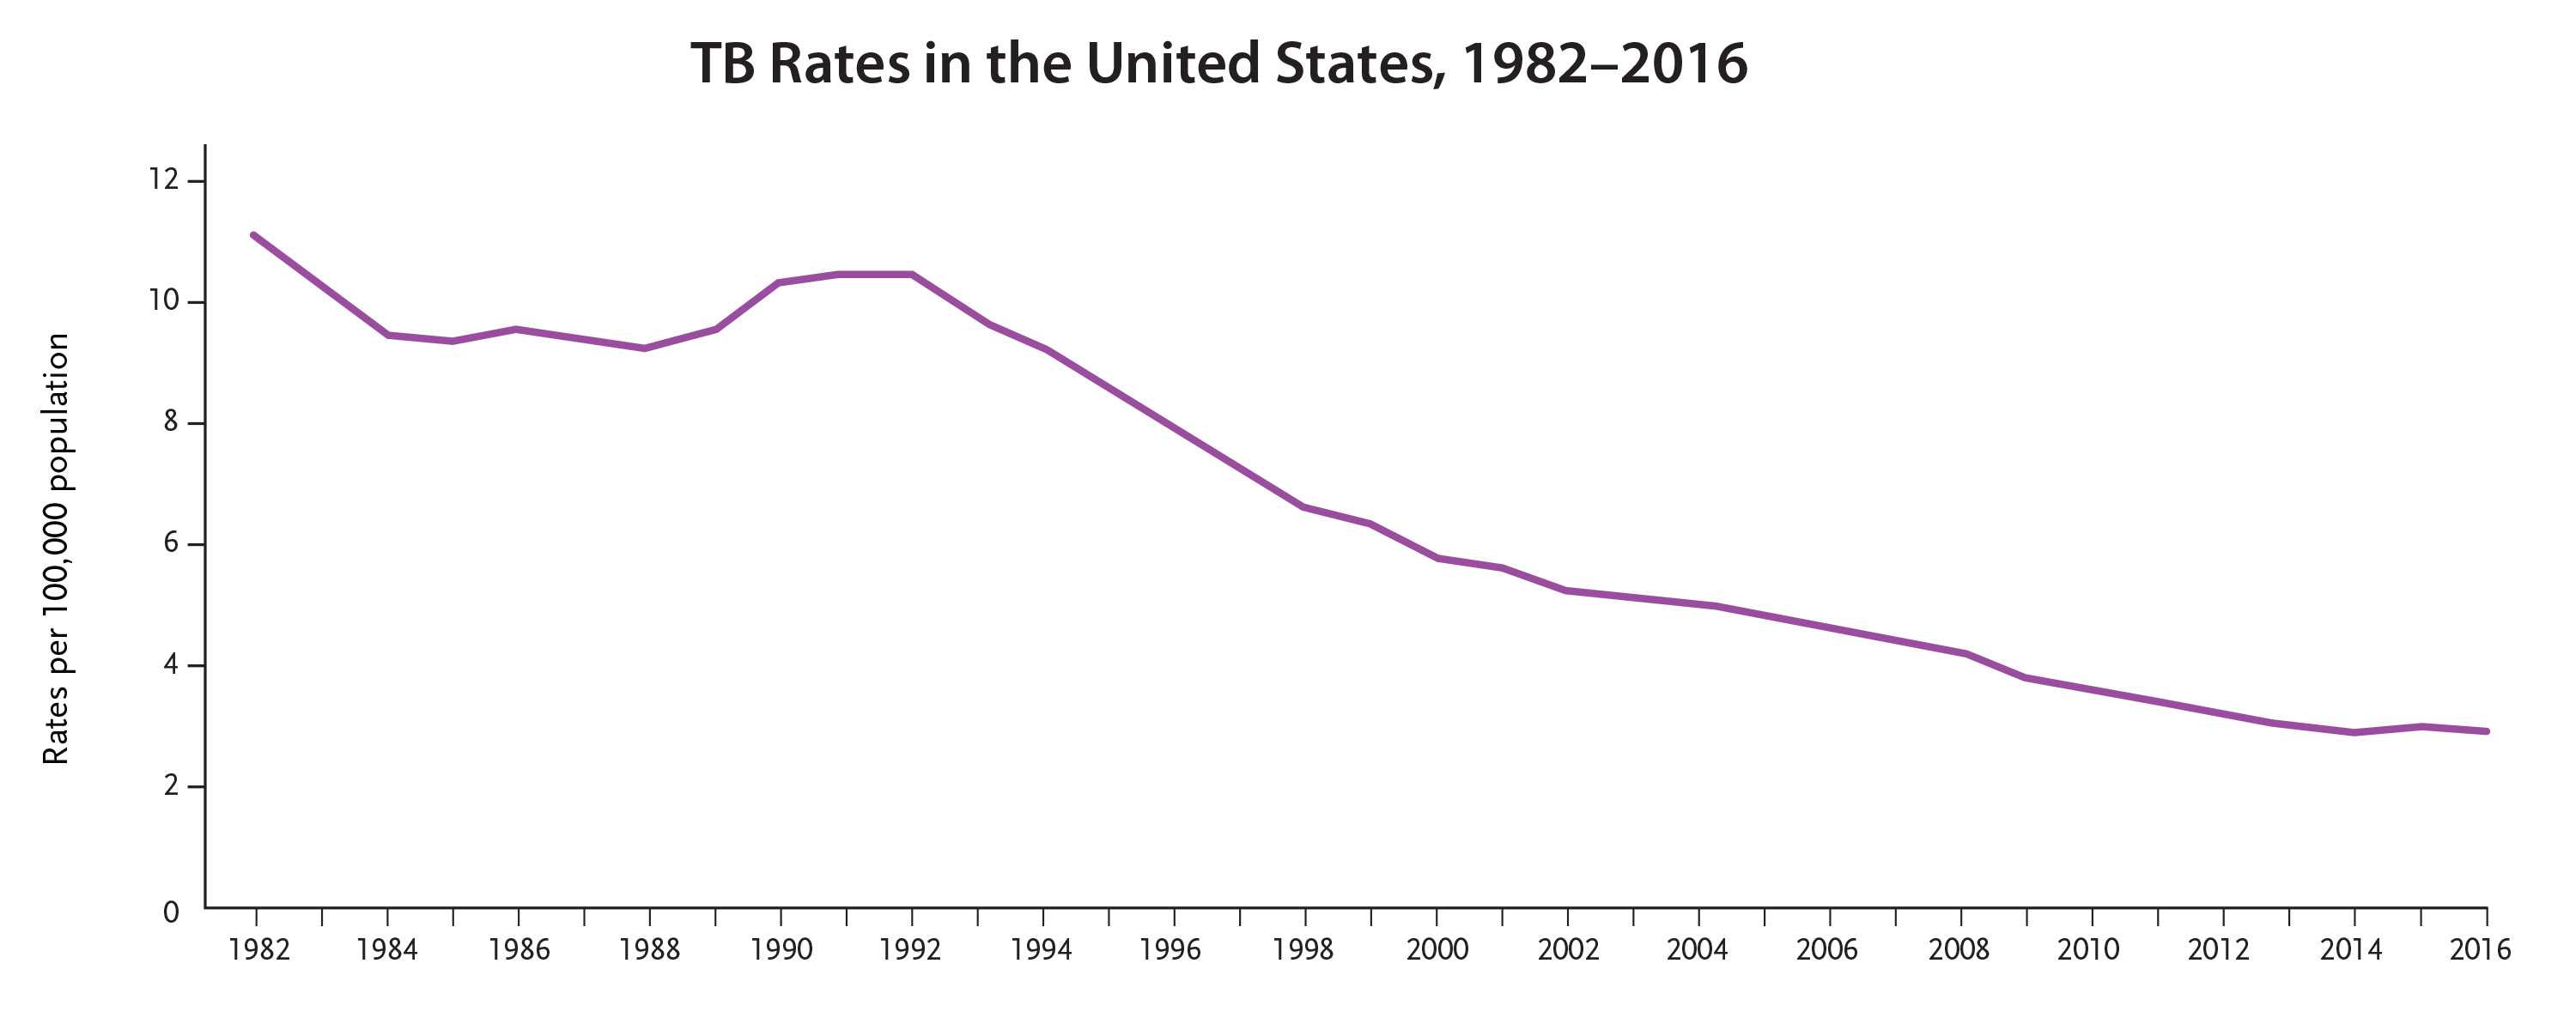
TB Rates in the United States, 1982-2016
View High Resolution Version
An annual decline in the rates of TB in the United States was seen beginning in 1993 until 2015 when the incidence rate remained the same as the previous year. Preliminary data for 2016 indicate a slightly decreased TB rate (2.9) compared to 2015 (3.0). This slow progress threatens the realization of TB elimination during this century.
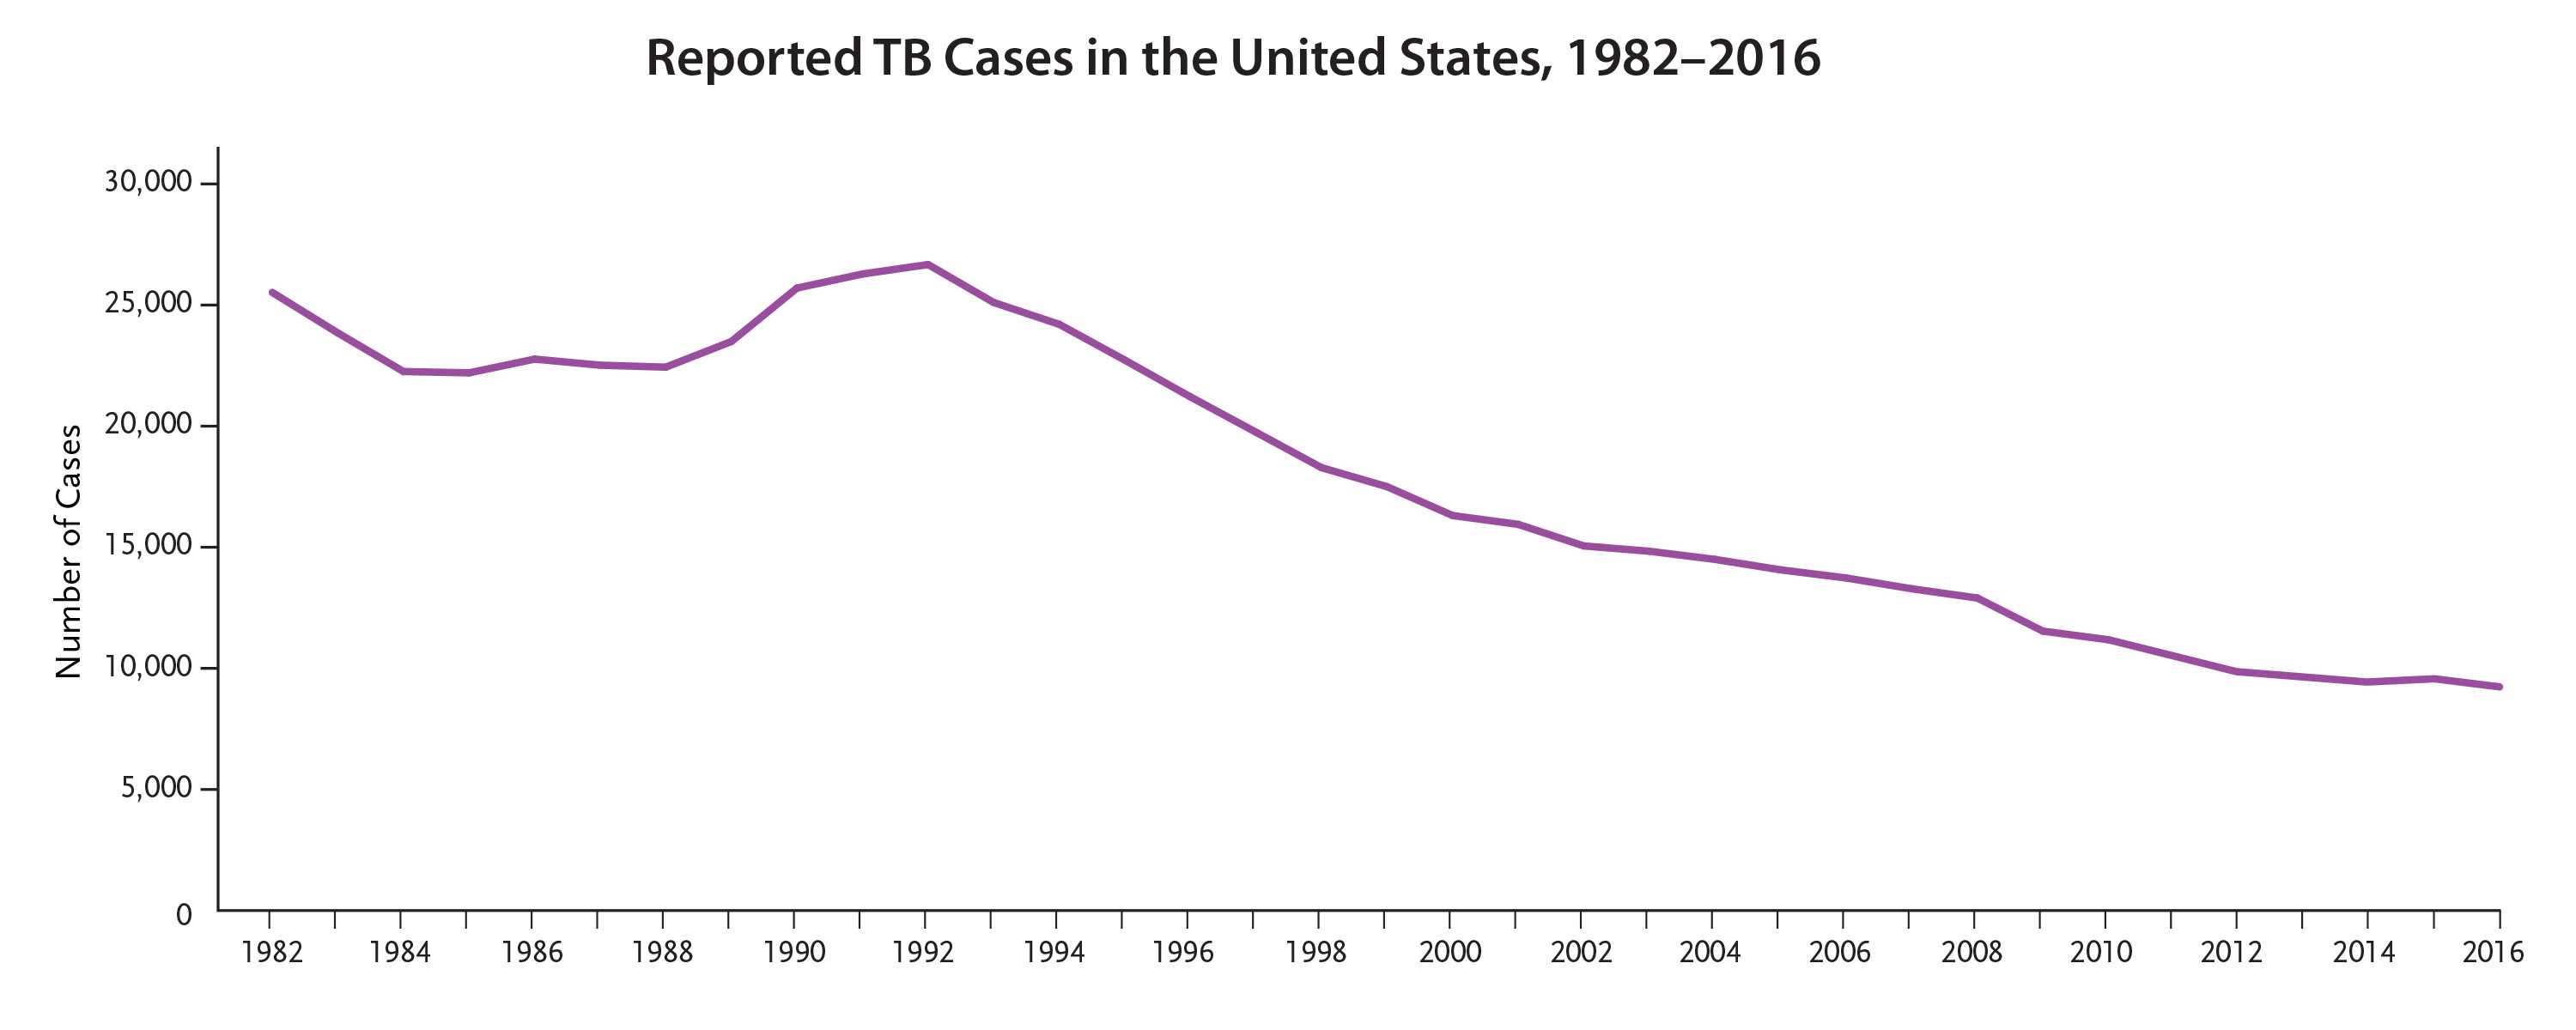
Reported TB Cases in the United States, 1982-2016
View High Resolution Version
An annual decline in the number of TB cases in the United States was seen beginning in 1993 until 2015 when the case count increased.
Preliminary 2016 data indicate a slight decline in reported TB cases (9,287), a slight decrease from 2015. However, more needs to be done to achieve TB elimination.


- Page last reviewed: March 23, 2017
- Page last updated: March 23, 2017
- Content source: