

Multimedia Resources
 ShareCompartir
Multimedia Resources


Graphics

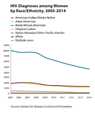
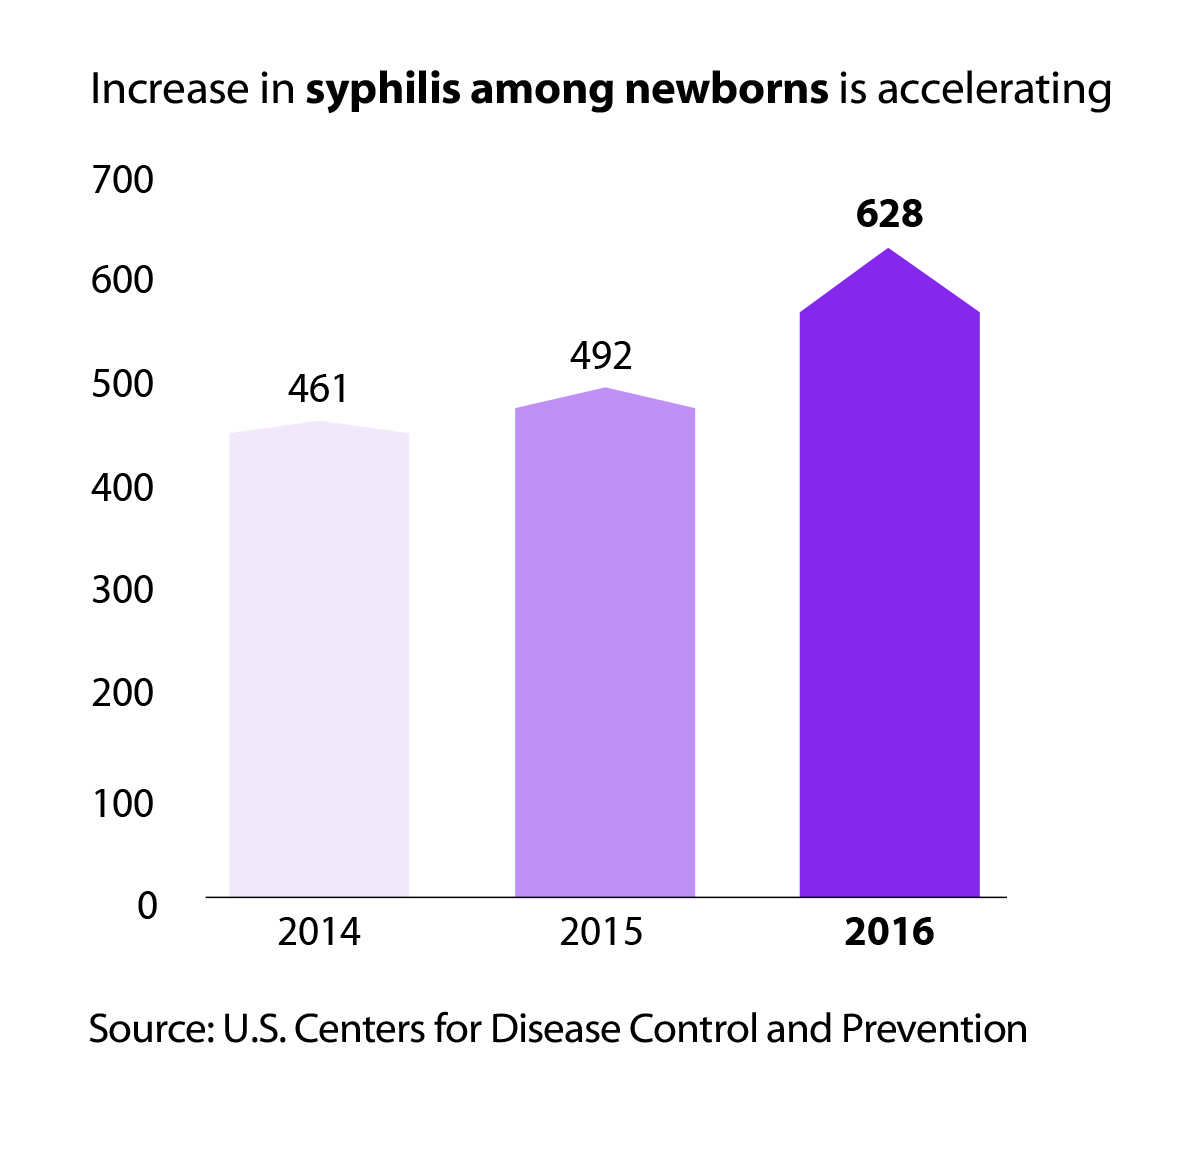
Increase in syphilis among newborns is accelerating

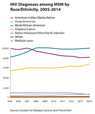
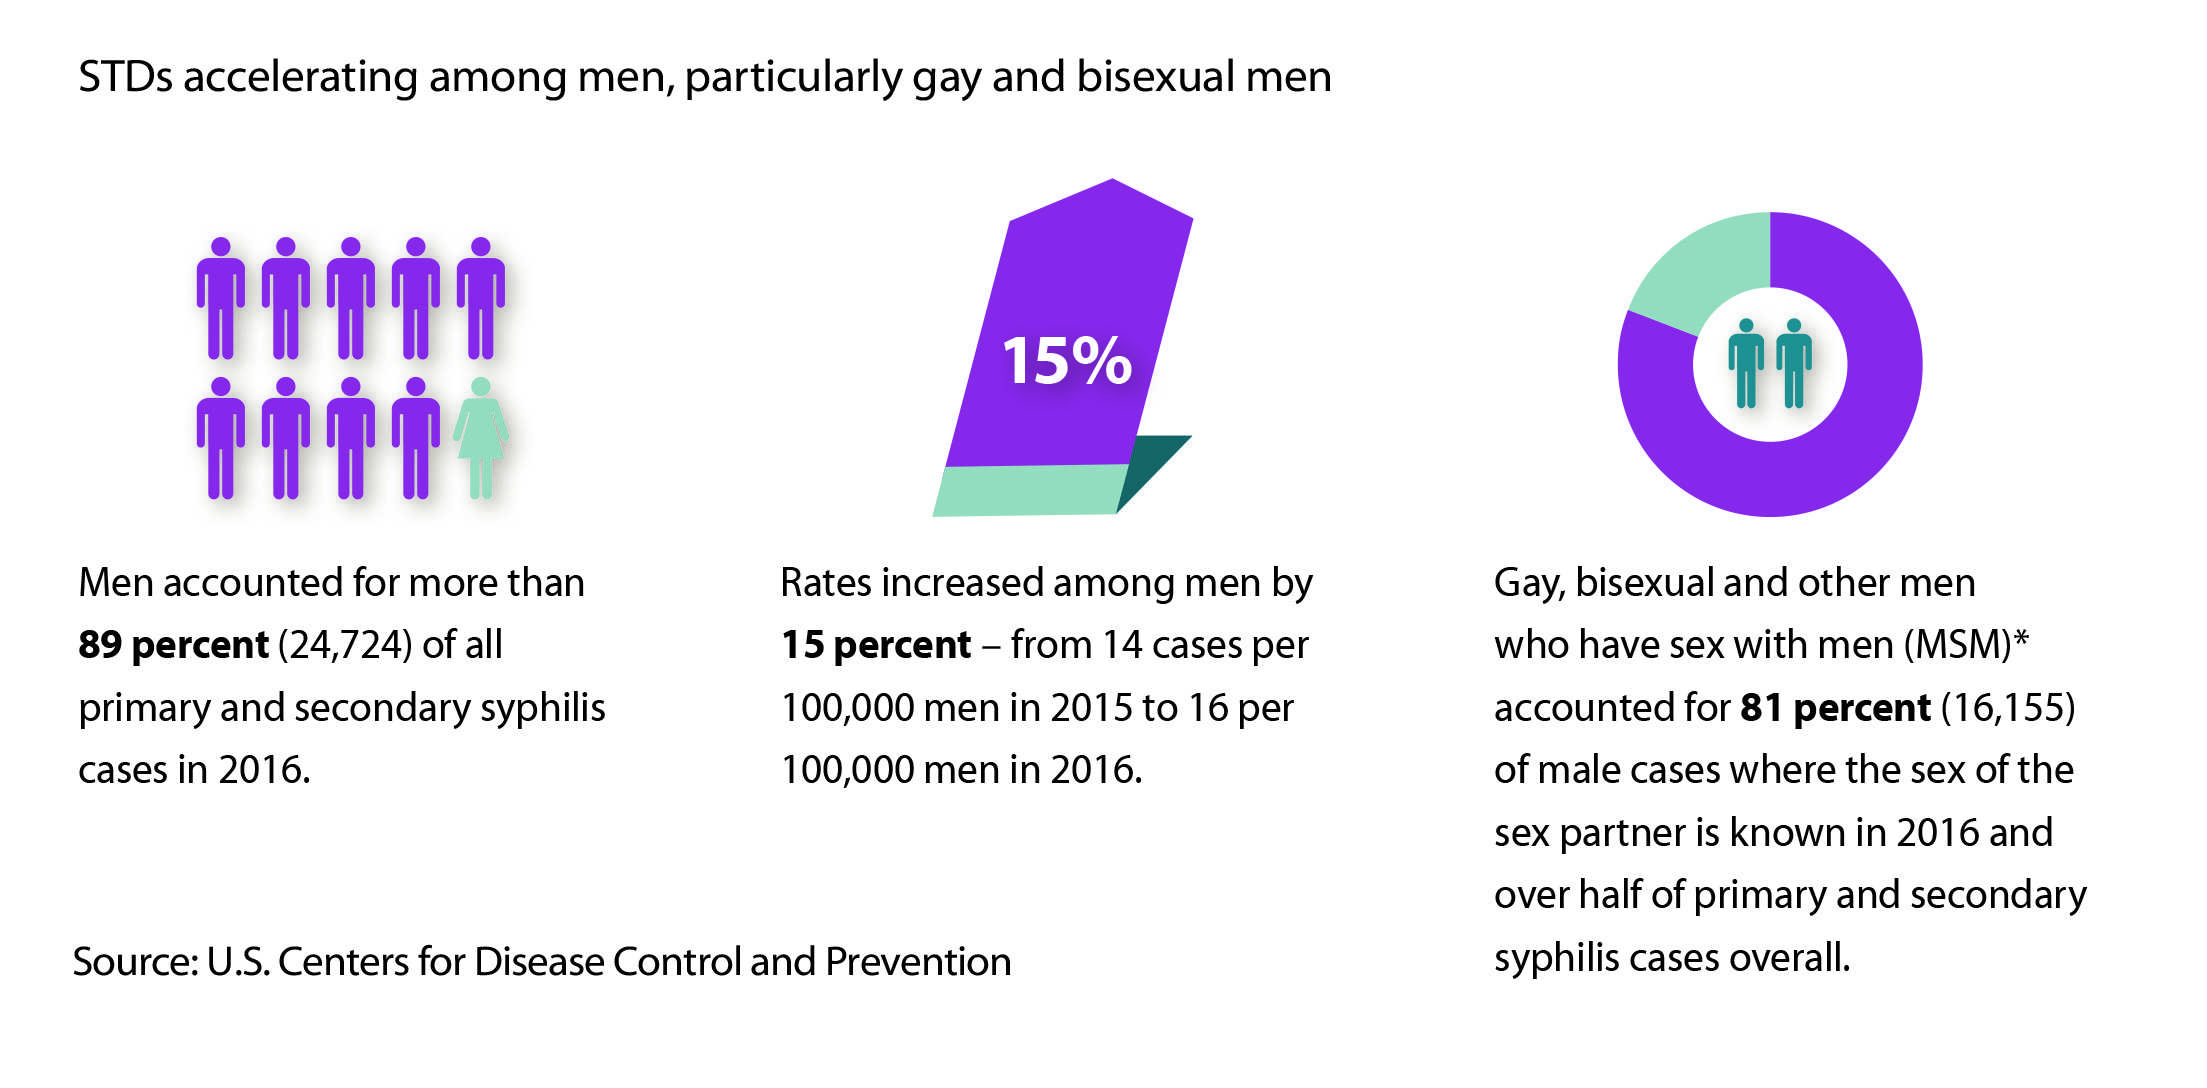
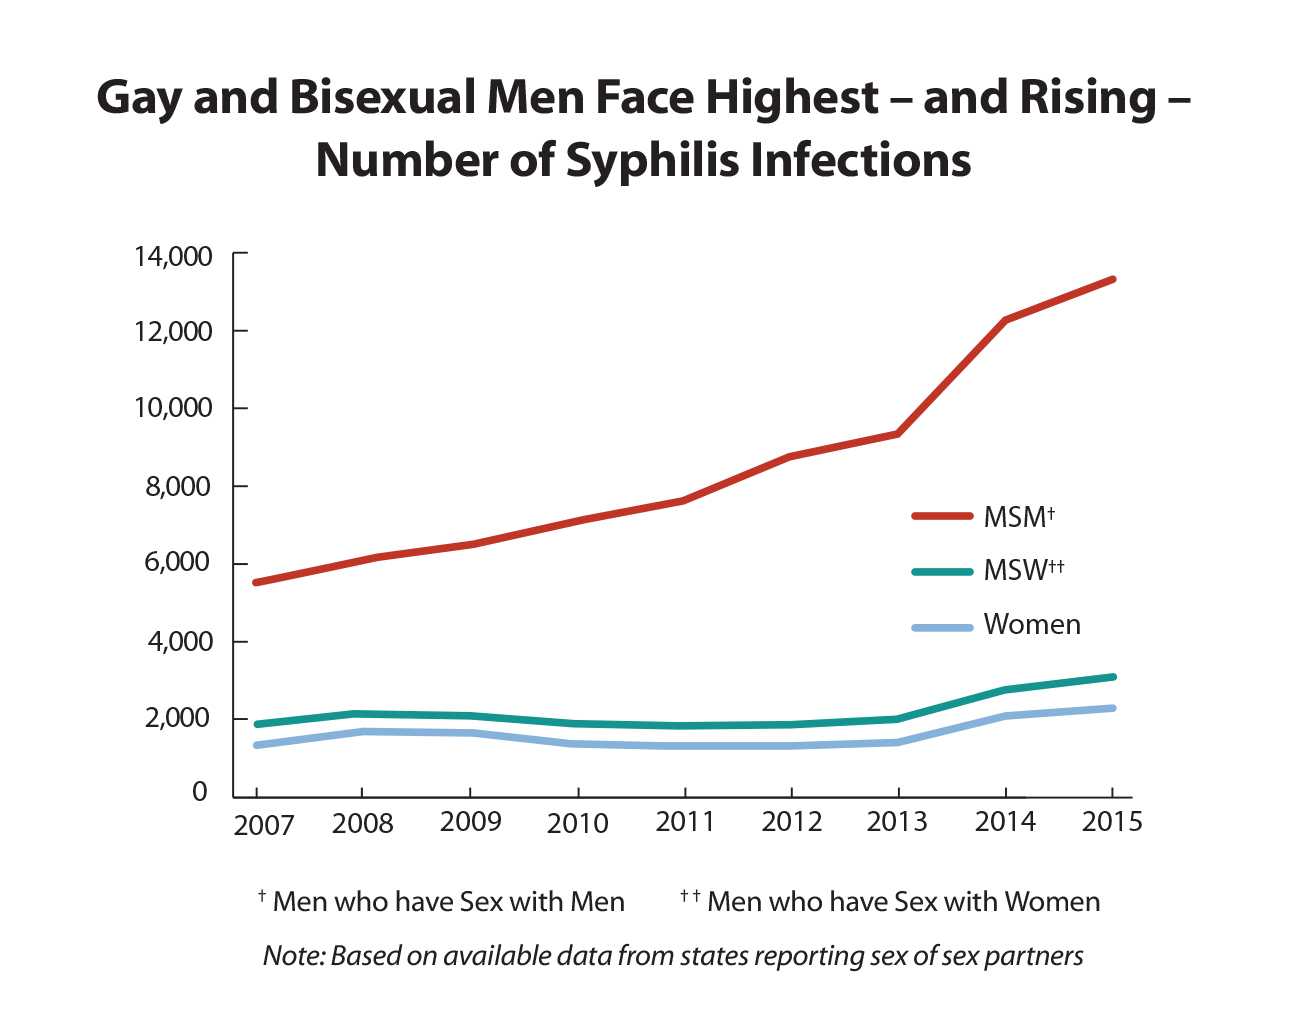
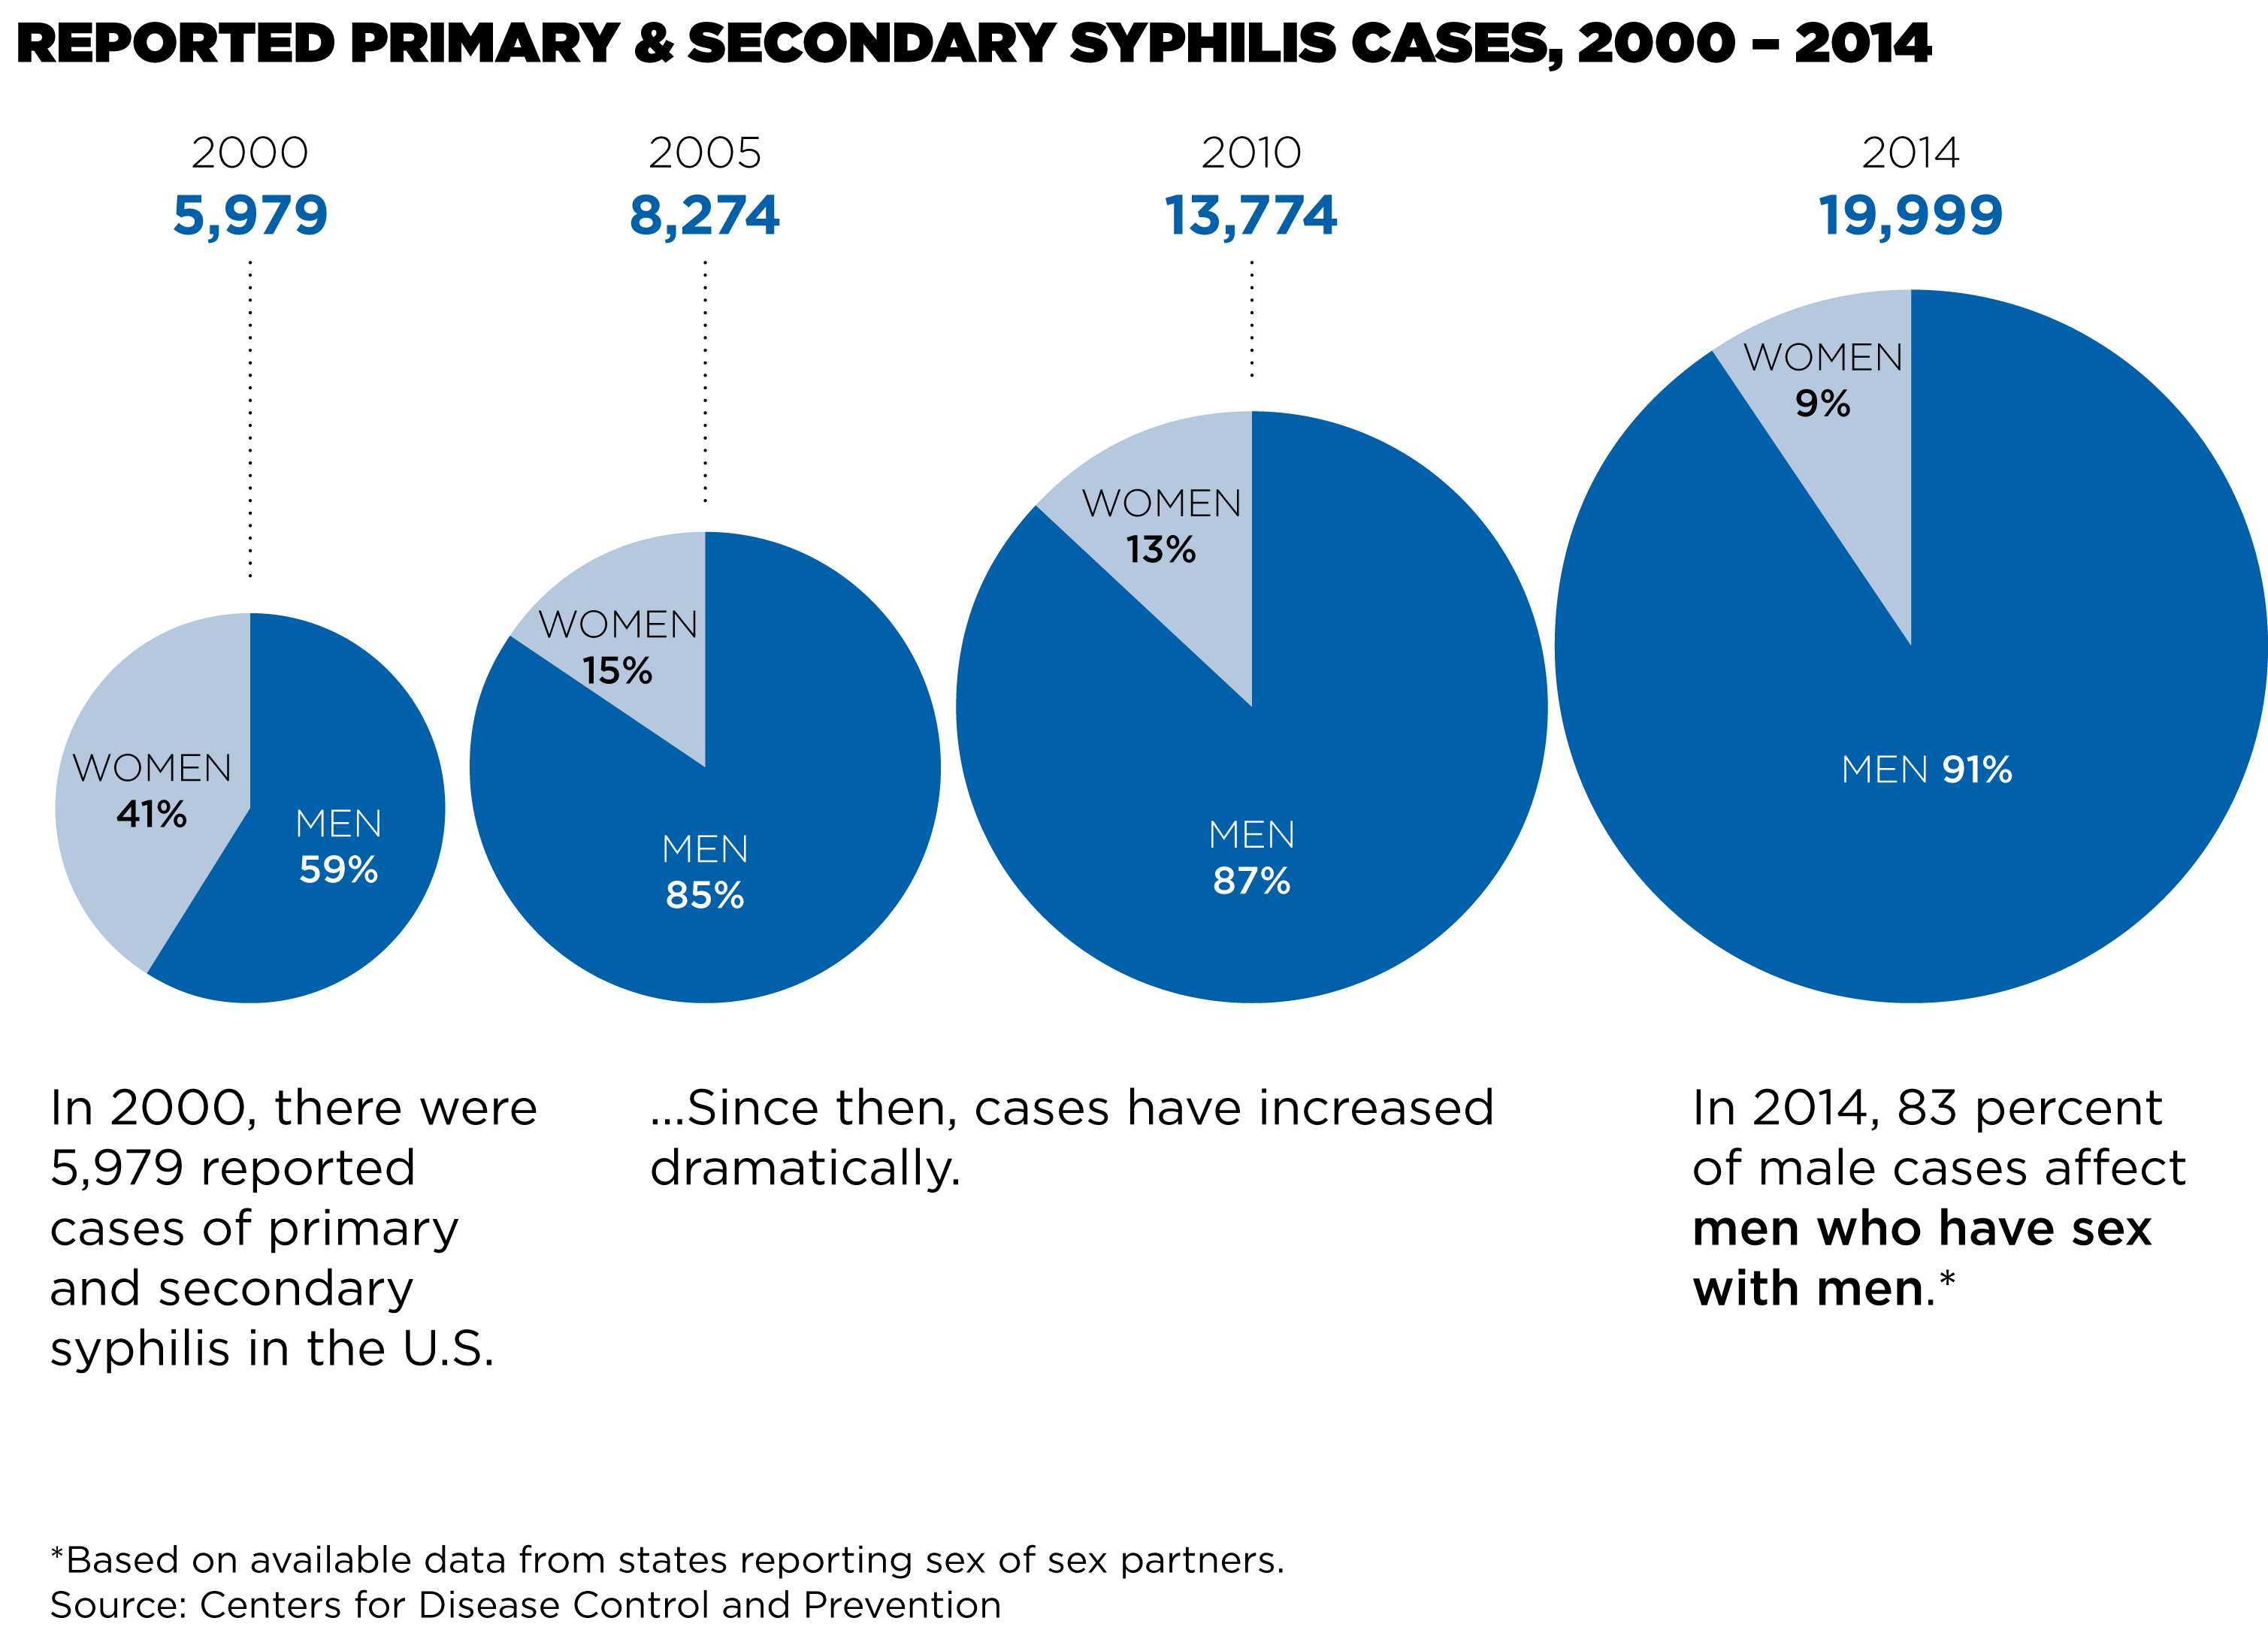
Burden of syphilis highest among men, particularly gay and bisexual

Illustration of the syphilis bacteria

Illustration of Neisseria gonorrhoeae

The Value of Chlamydia Screening

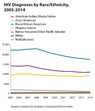
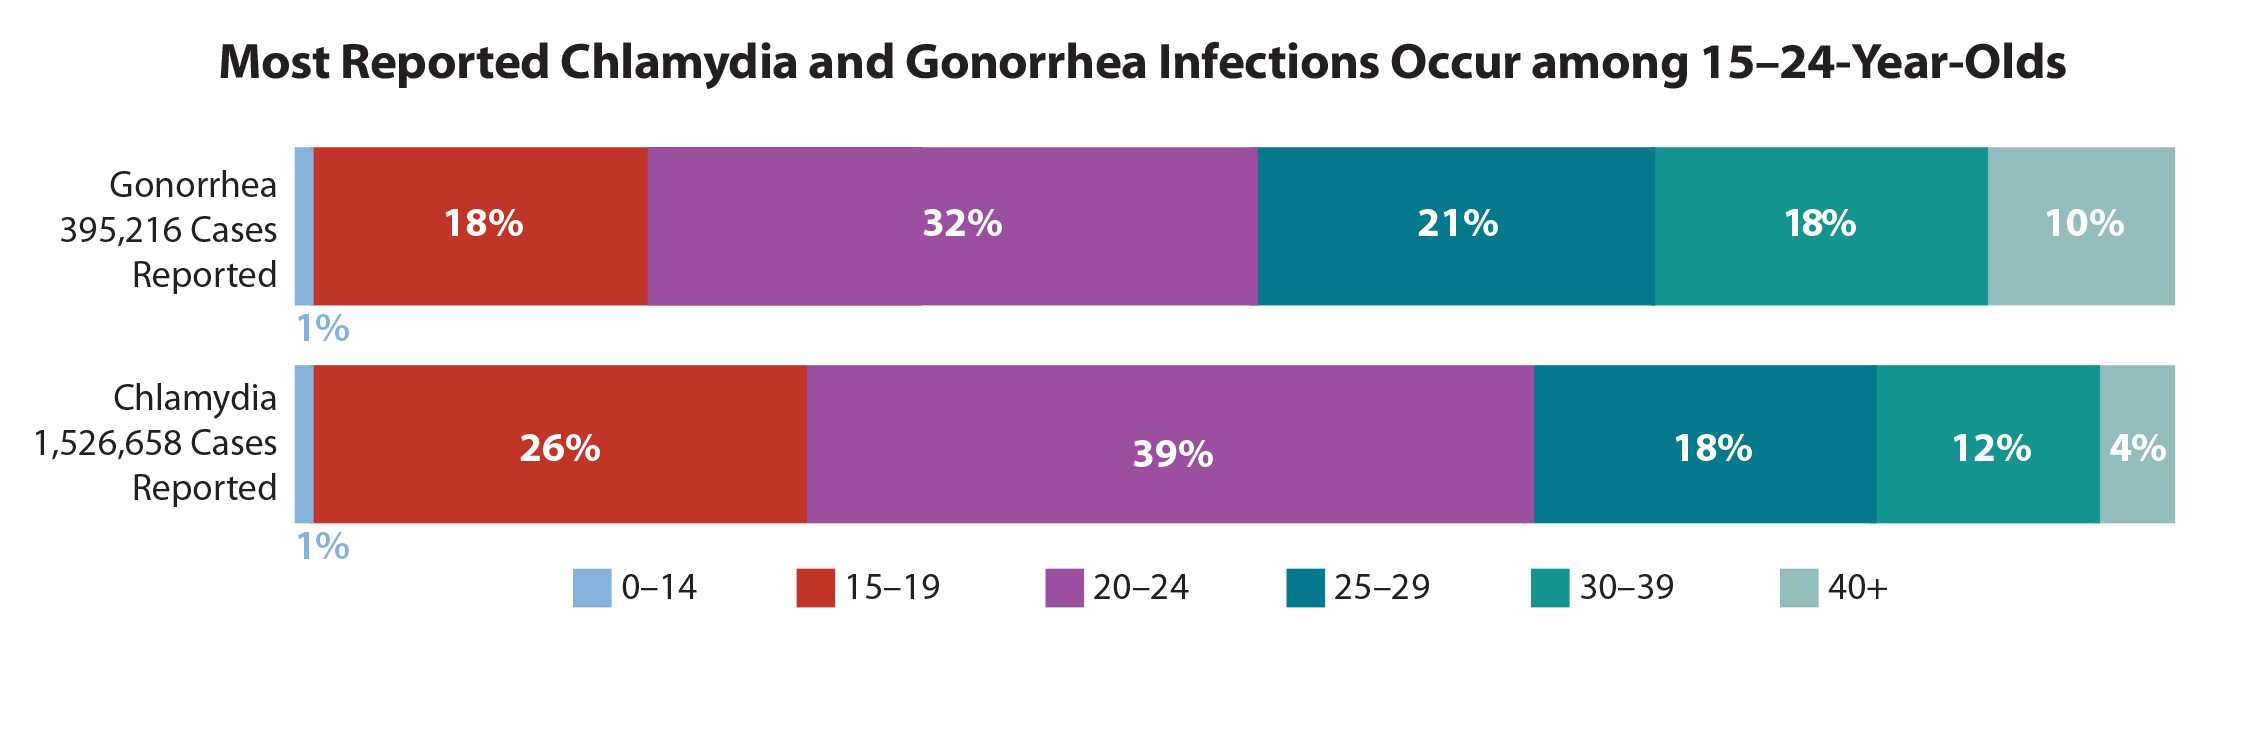
Most reported chlamydia and gonorrhea infections occur among youth

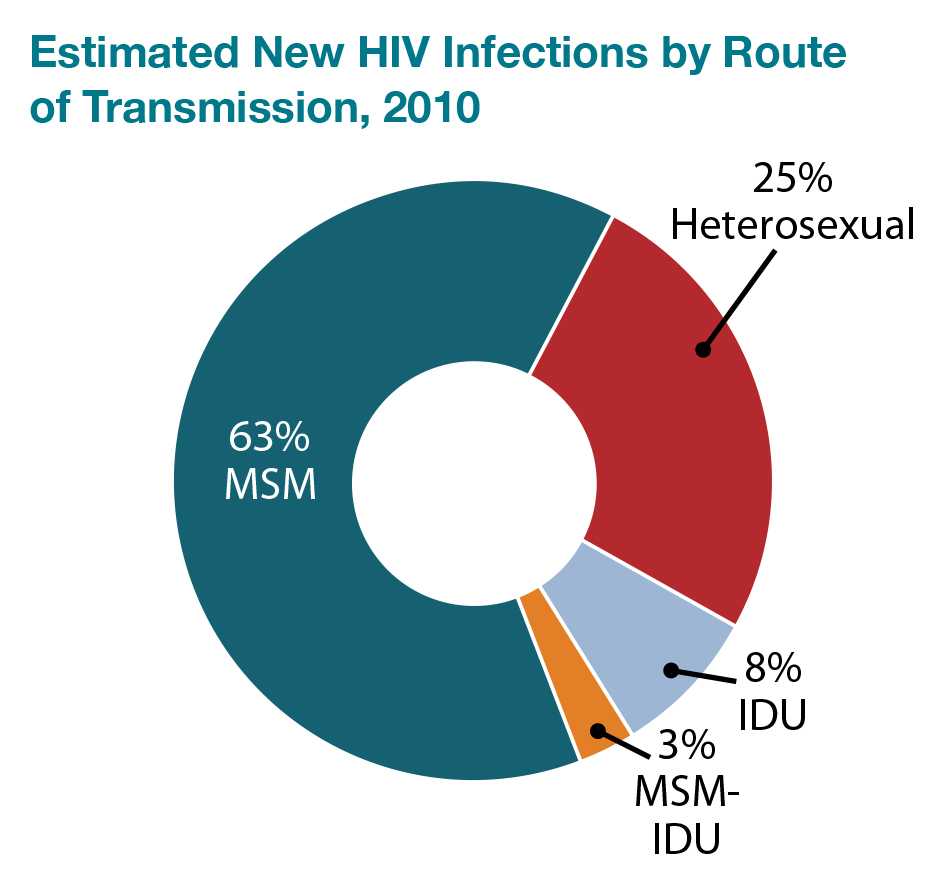
Rising syphilis infections among MSM

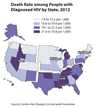
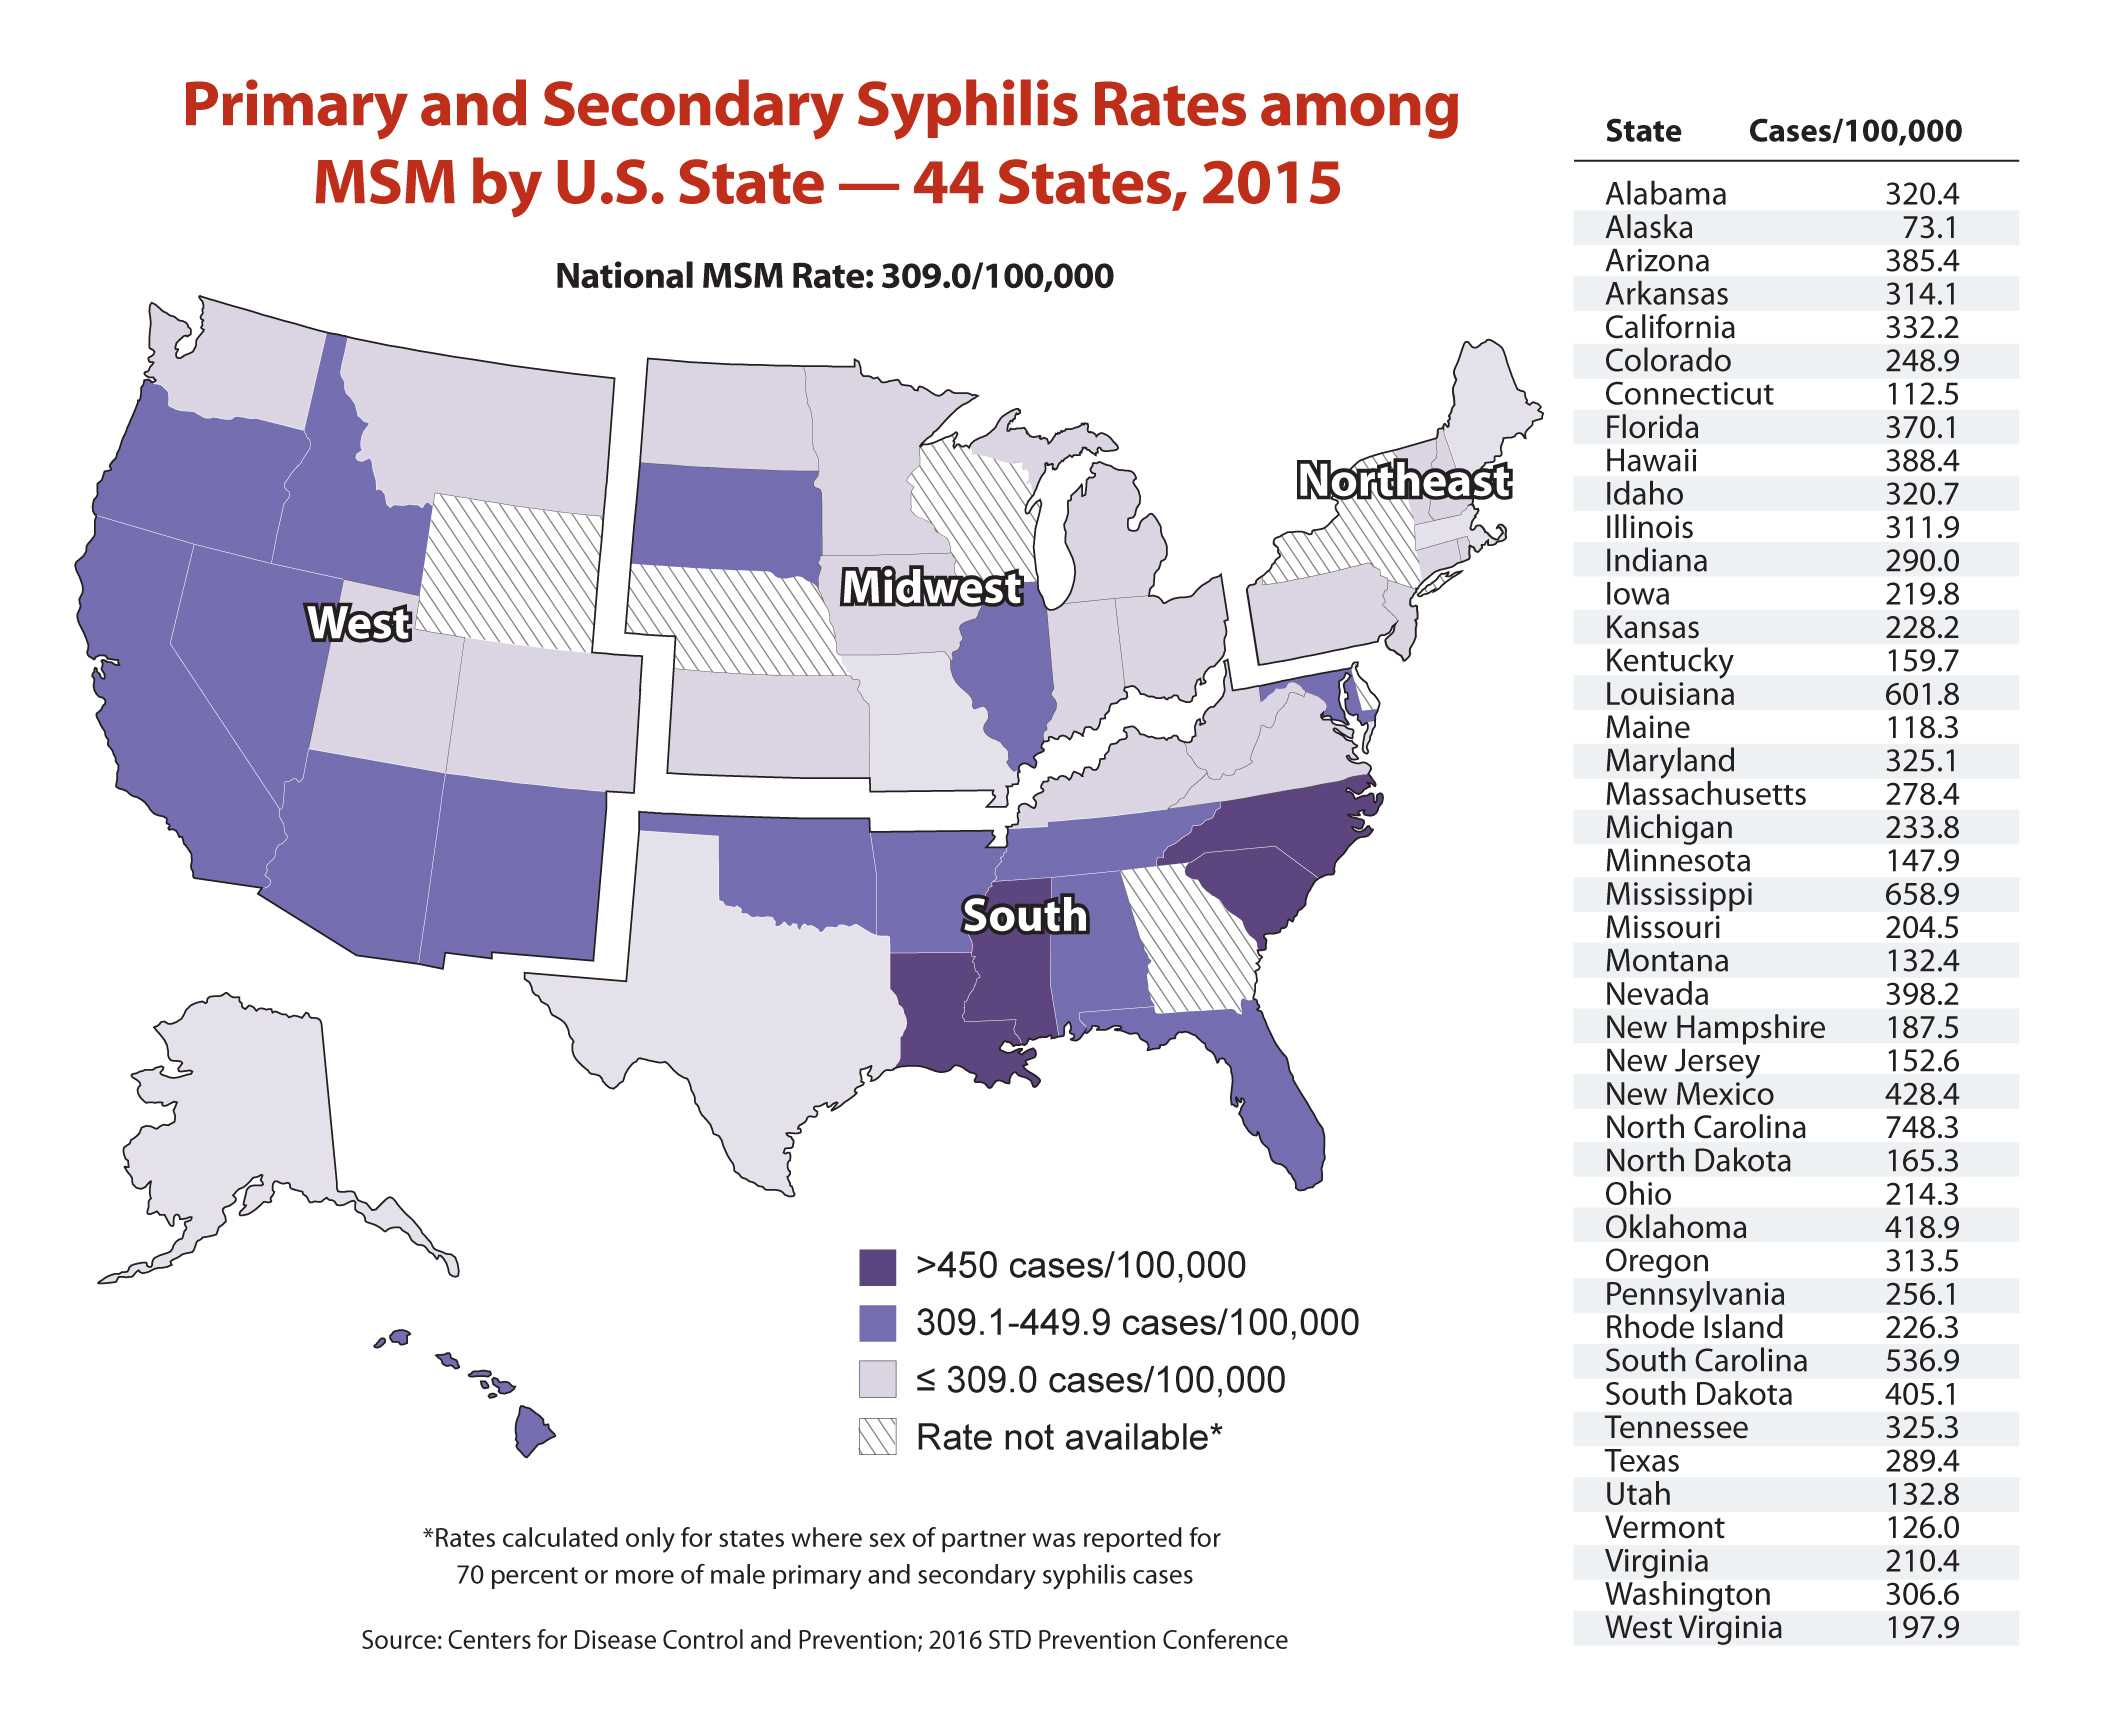
Primary and Secondary Syphilis Rates among MSM by U.S. State-44 states, 2015

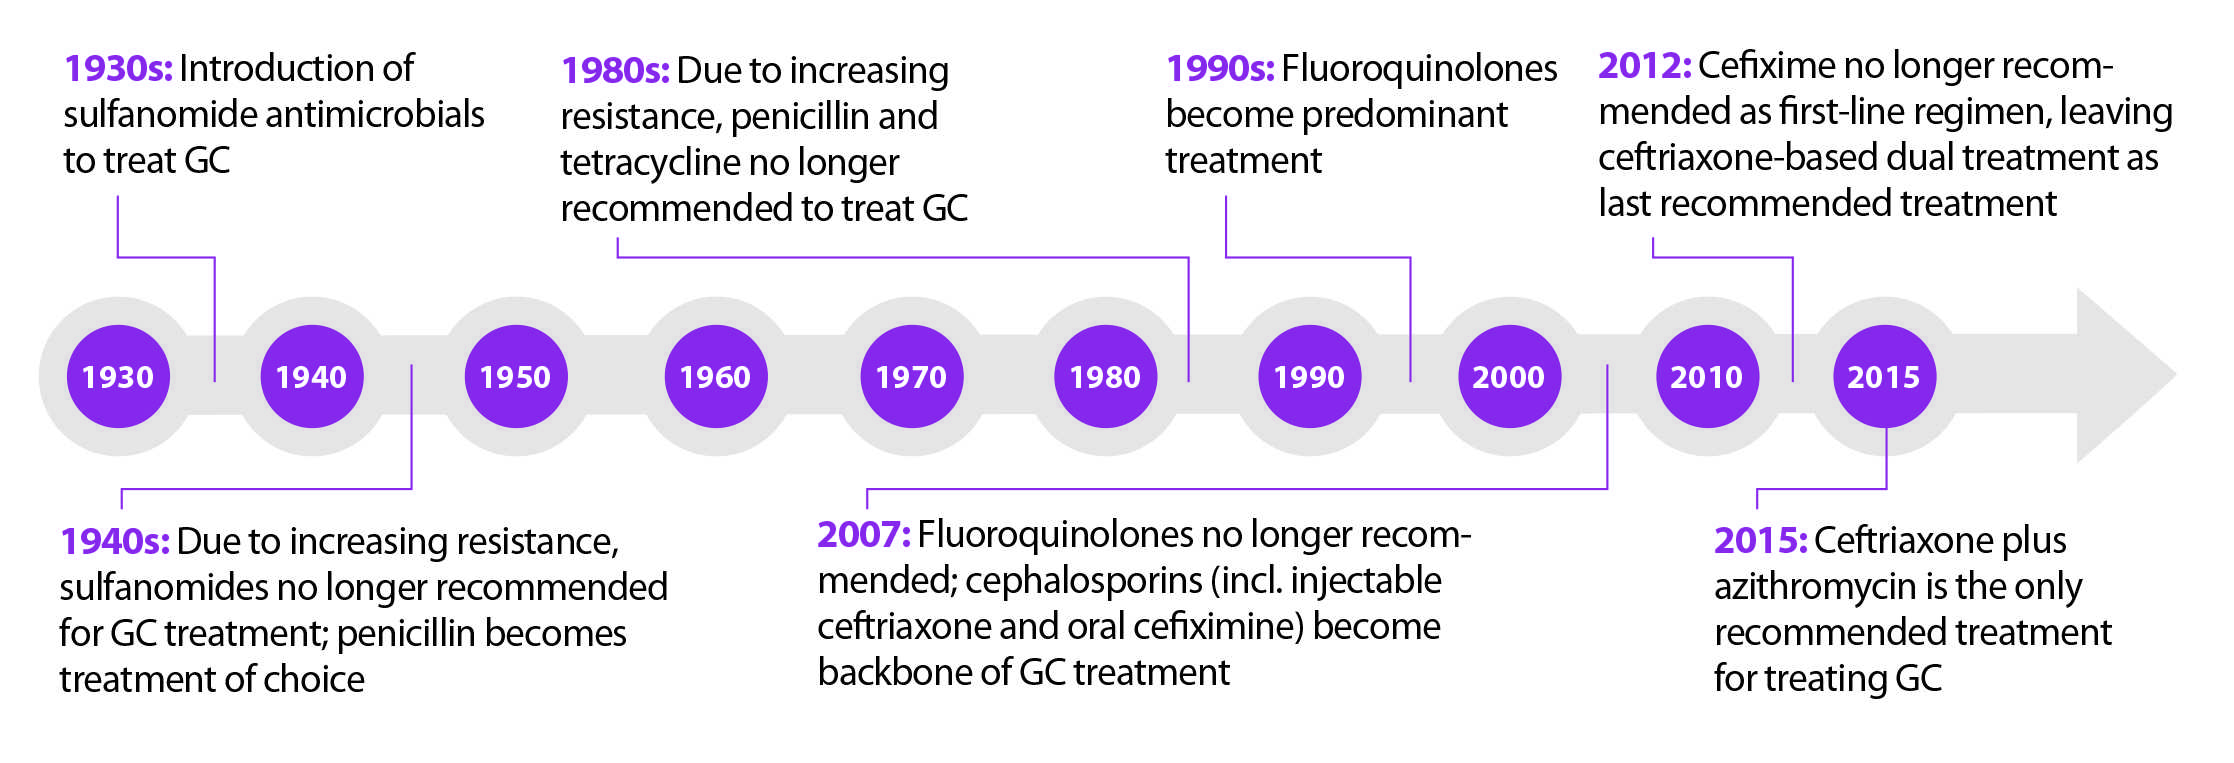
Historical Trends in Drug Resistance and CDC Treatment Recommendations

Illustration of Neisseria gonorrhoeae under a microscope
The Value of Chlamydia Screening

Rising syphilis infections from 2000 through 2014

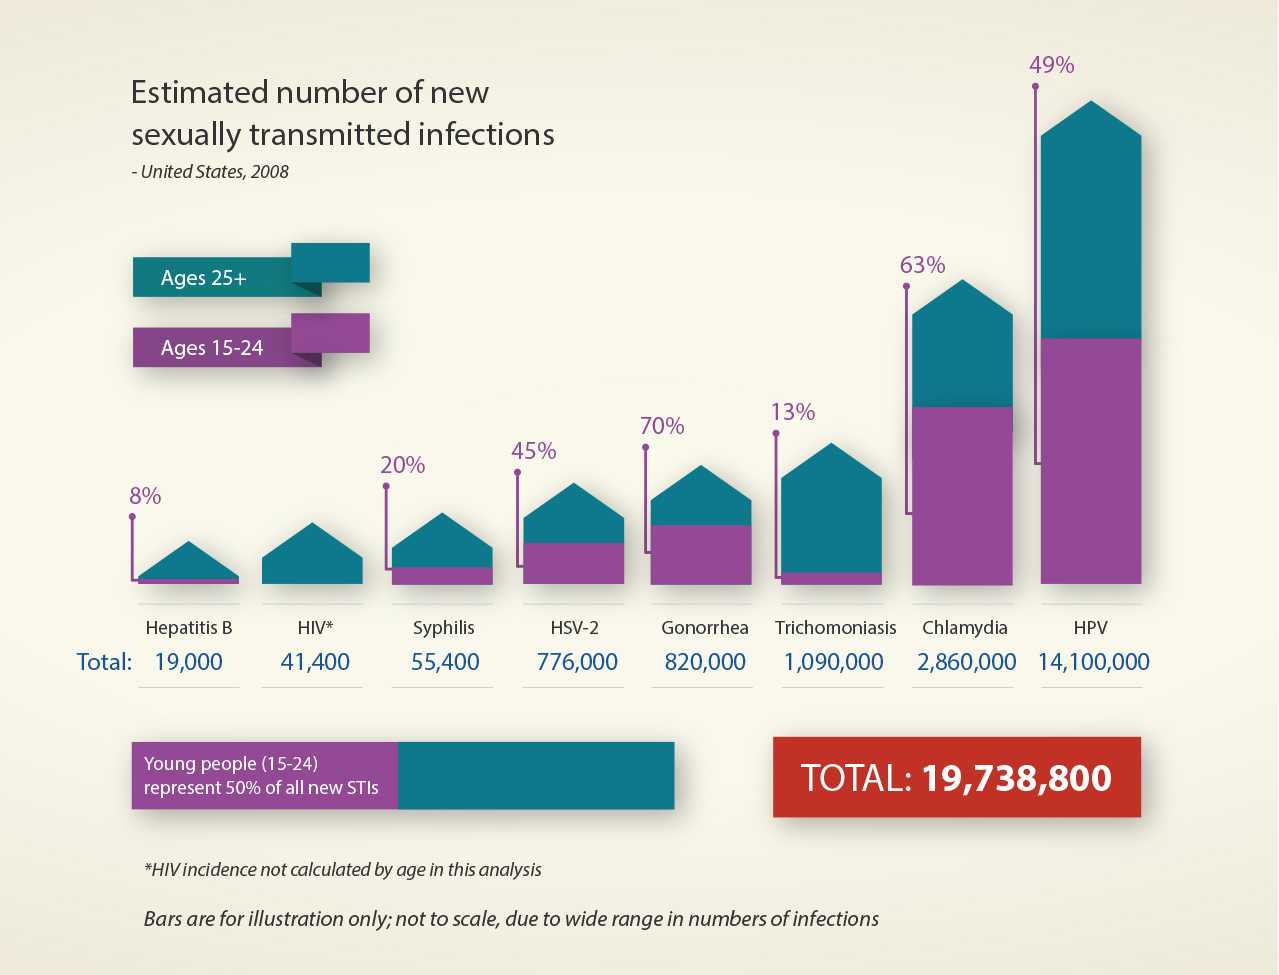
Estimated number of new sexually transmitted infections
Infographics
Video


“Taking an Adolescent’s Sexual History” with Dr. Gail Bolan

“New Treatment Guidelines for Gonorrhea” with Dr. Bob Kirkcaldy
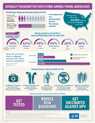
 Illustration of Mycobacterium tuberculosis
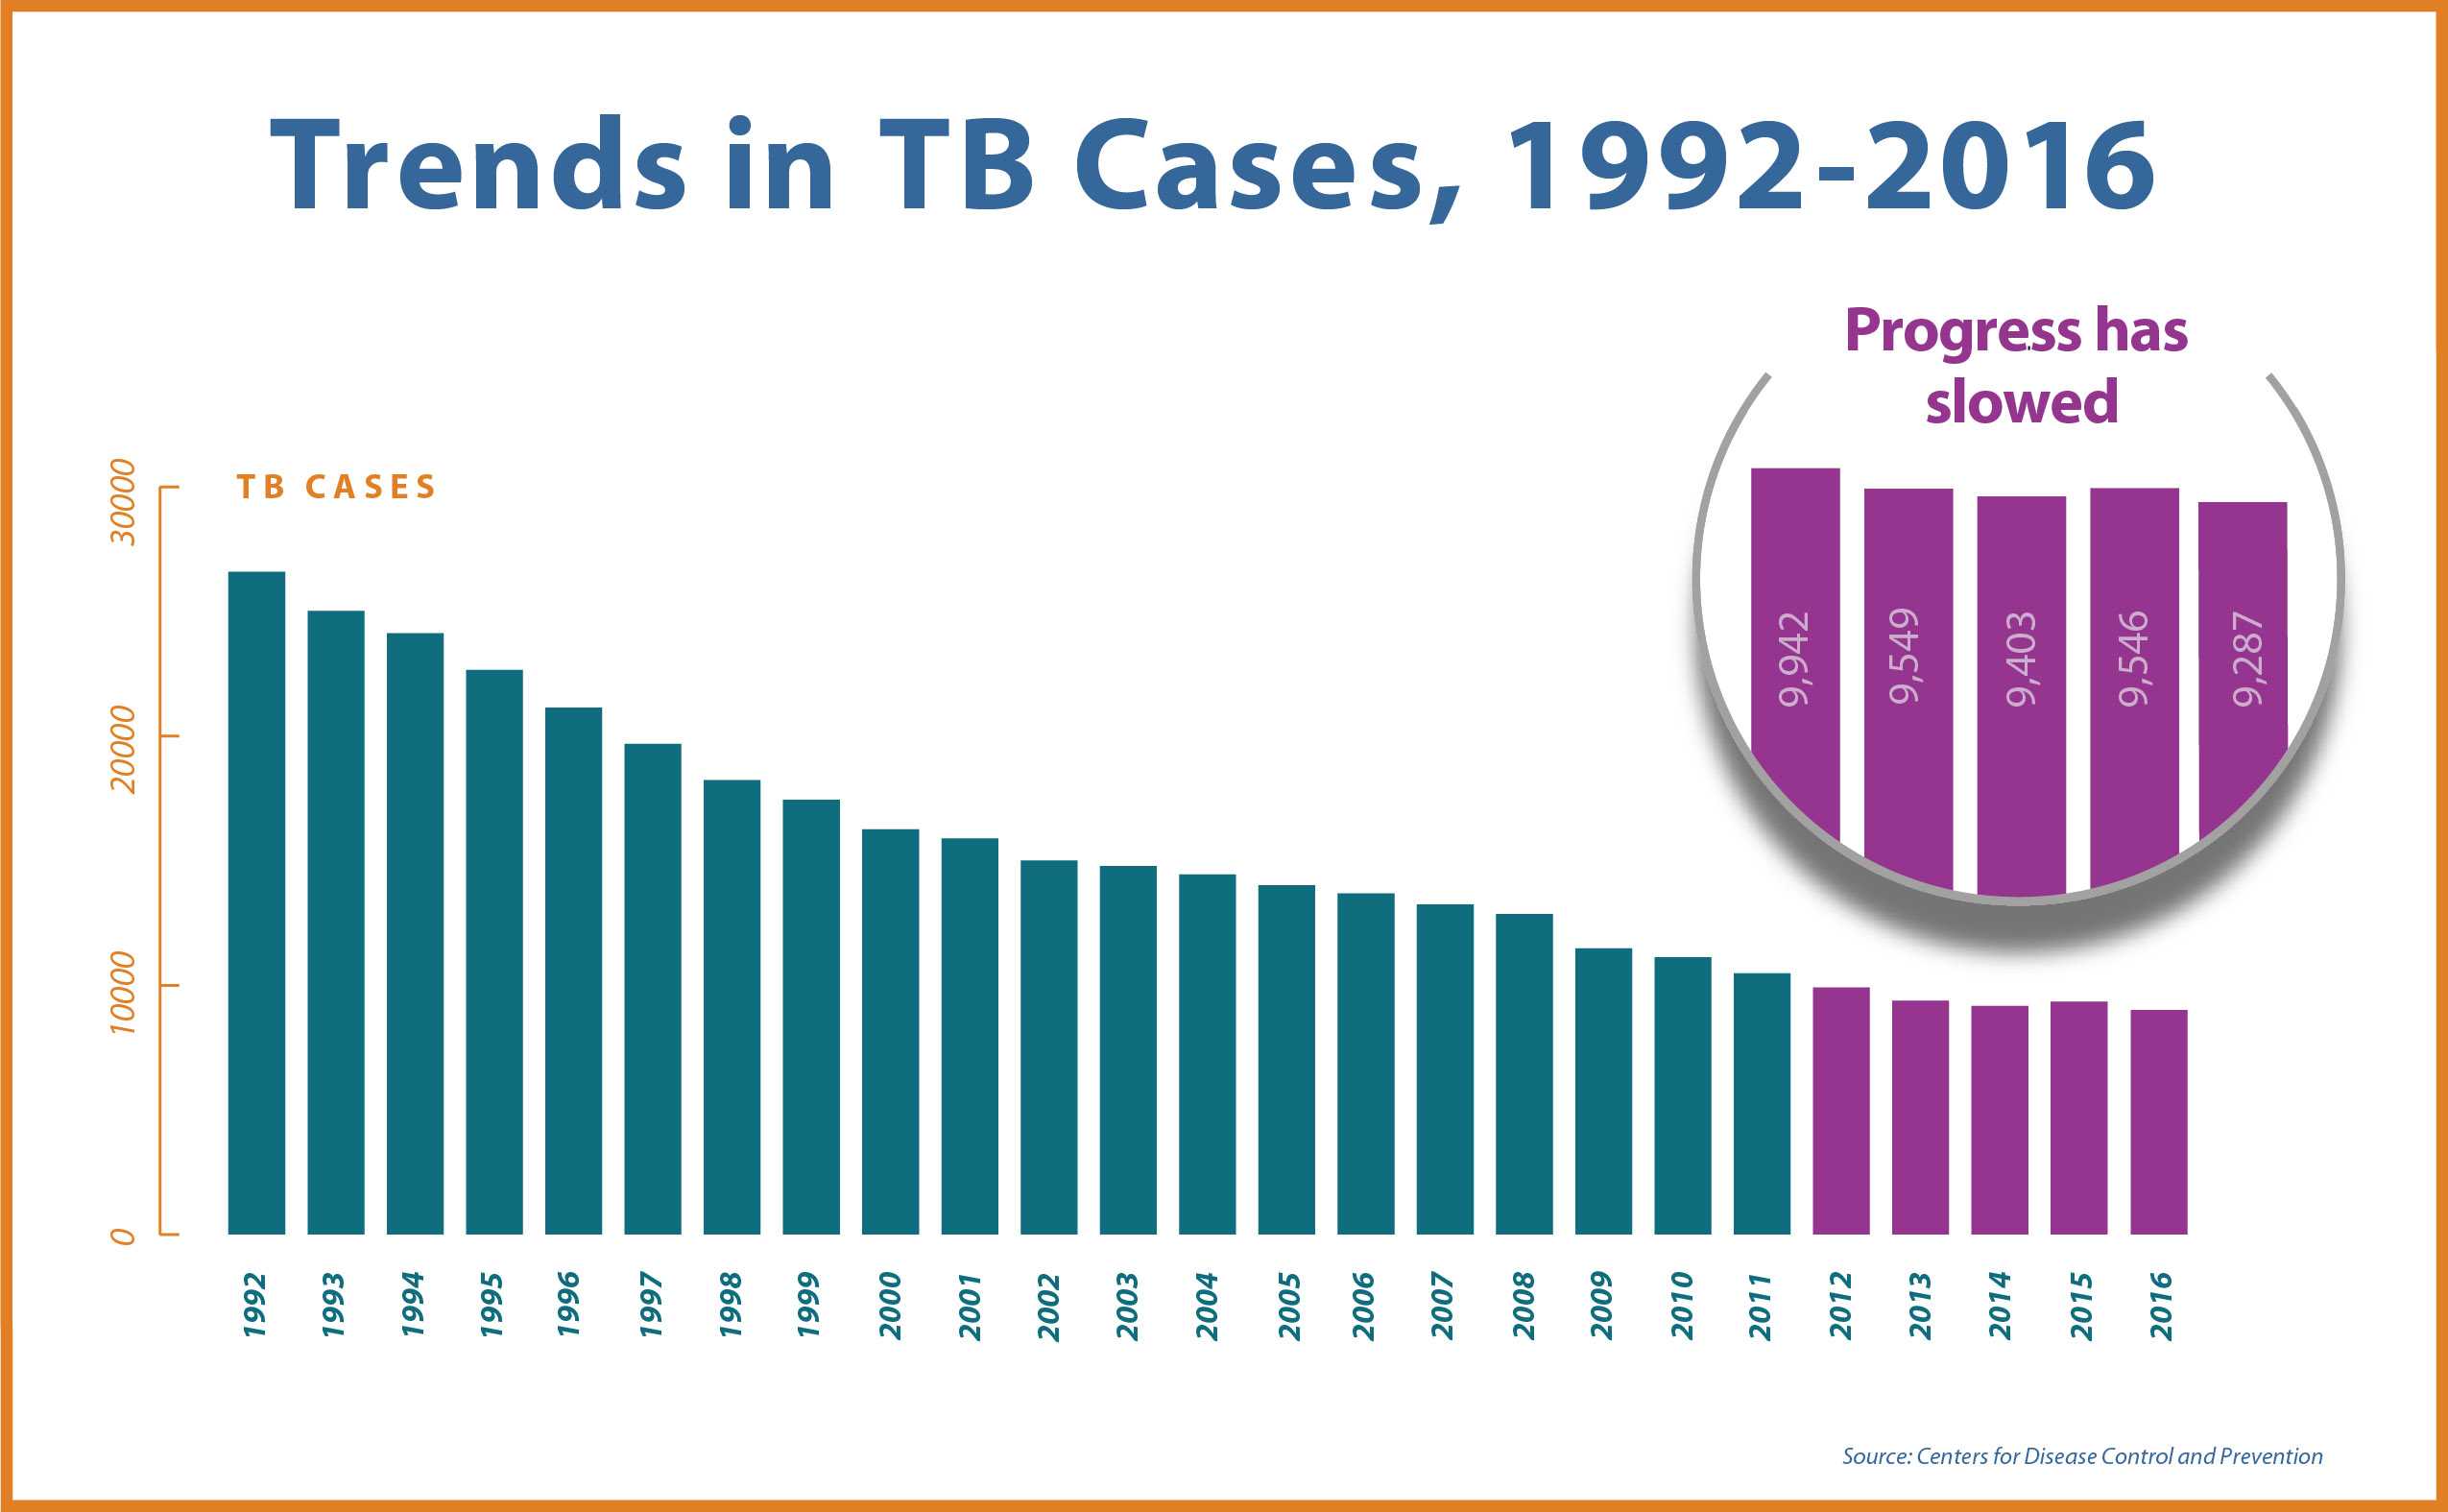 Trends in TB Cases, 1992- 2016
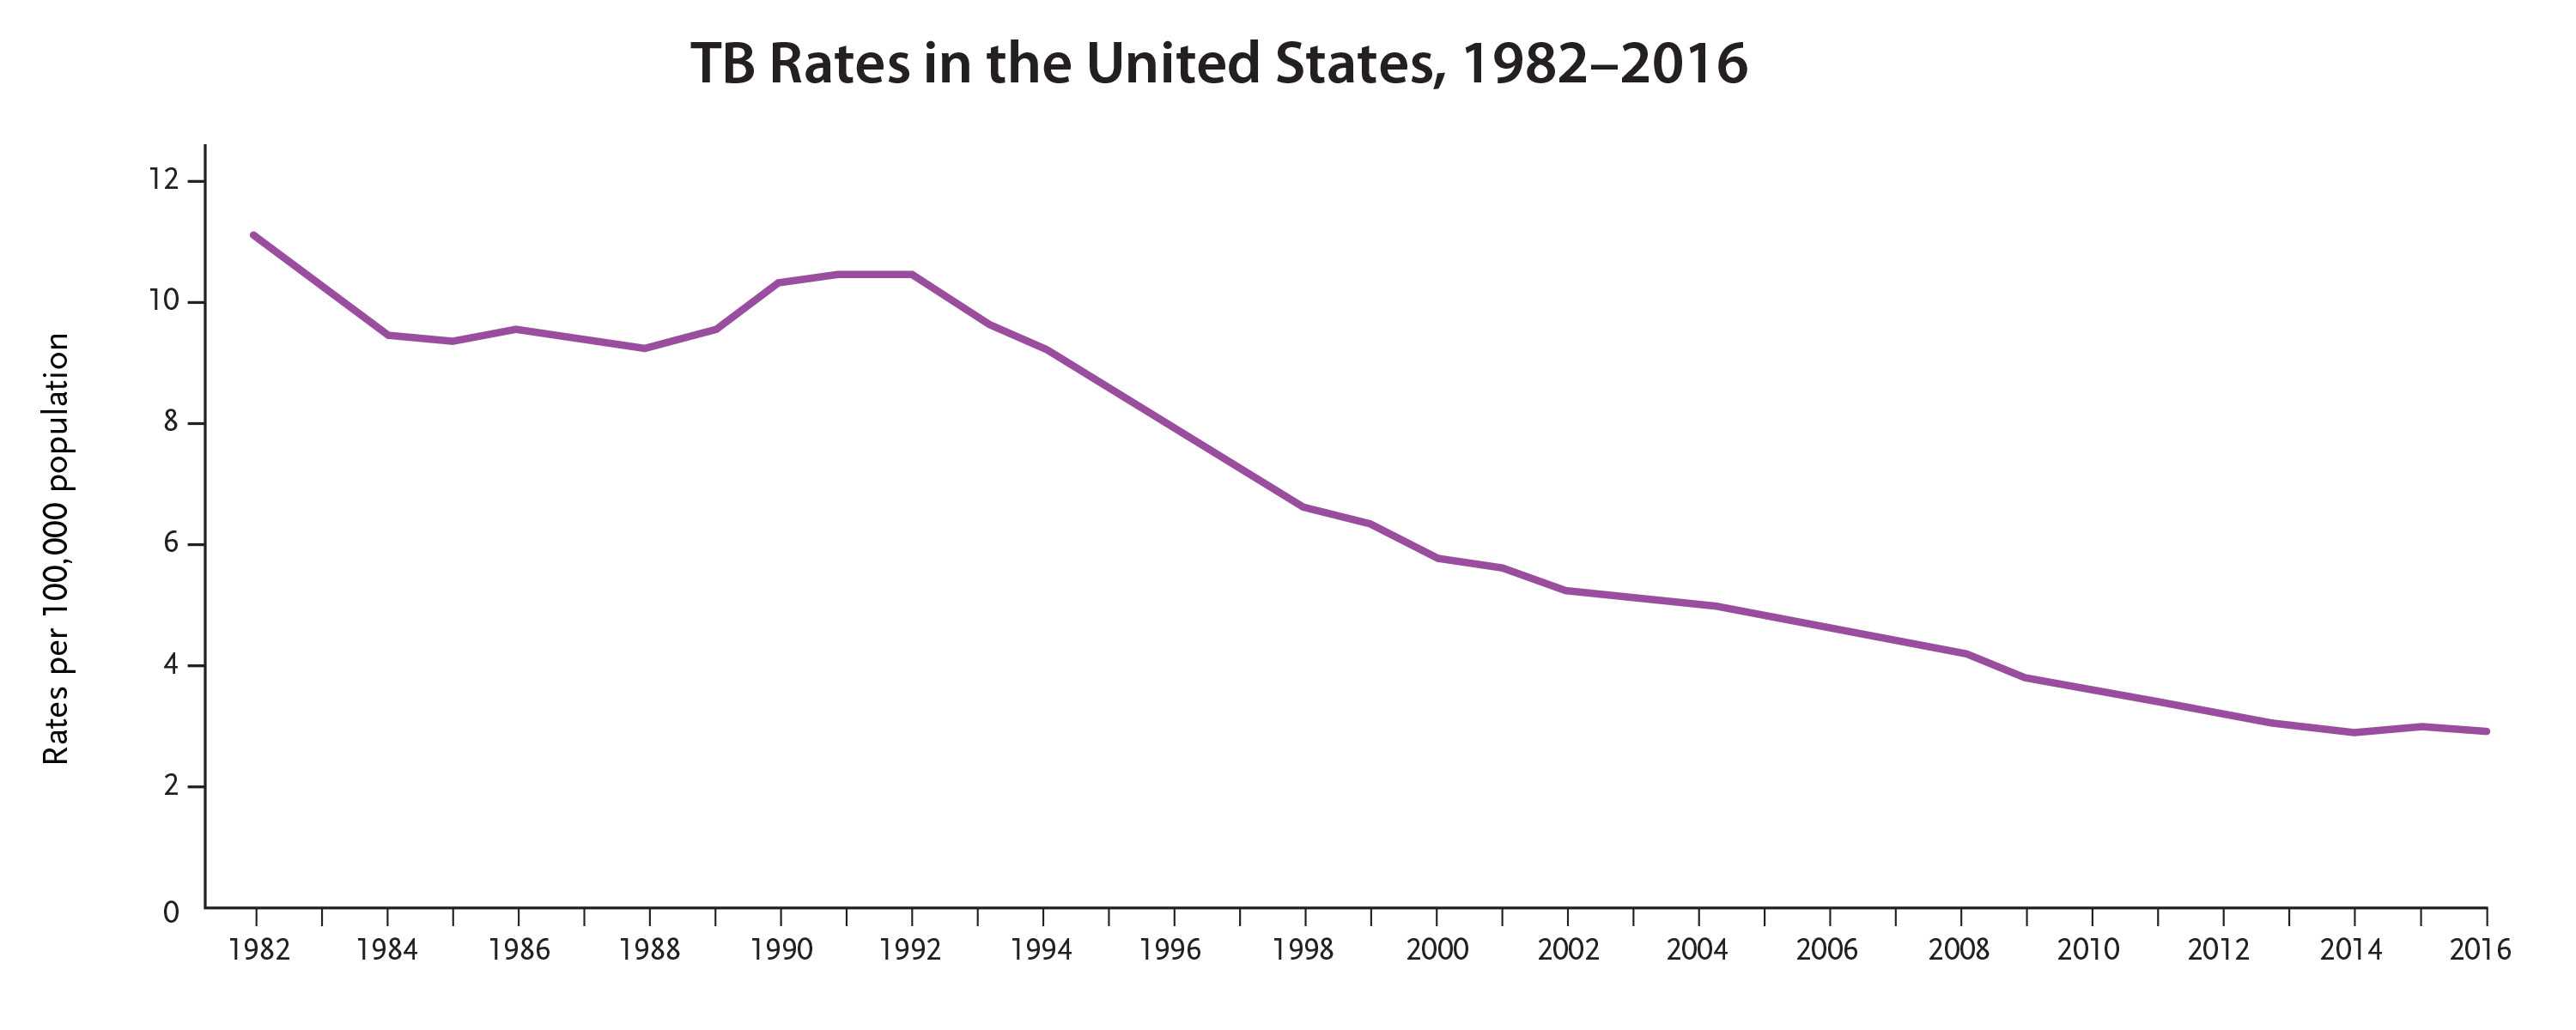 TB Rates in the United States, 1982-2016
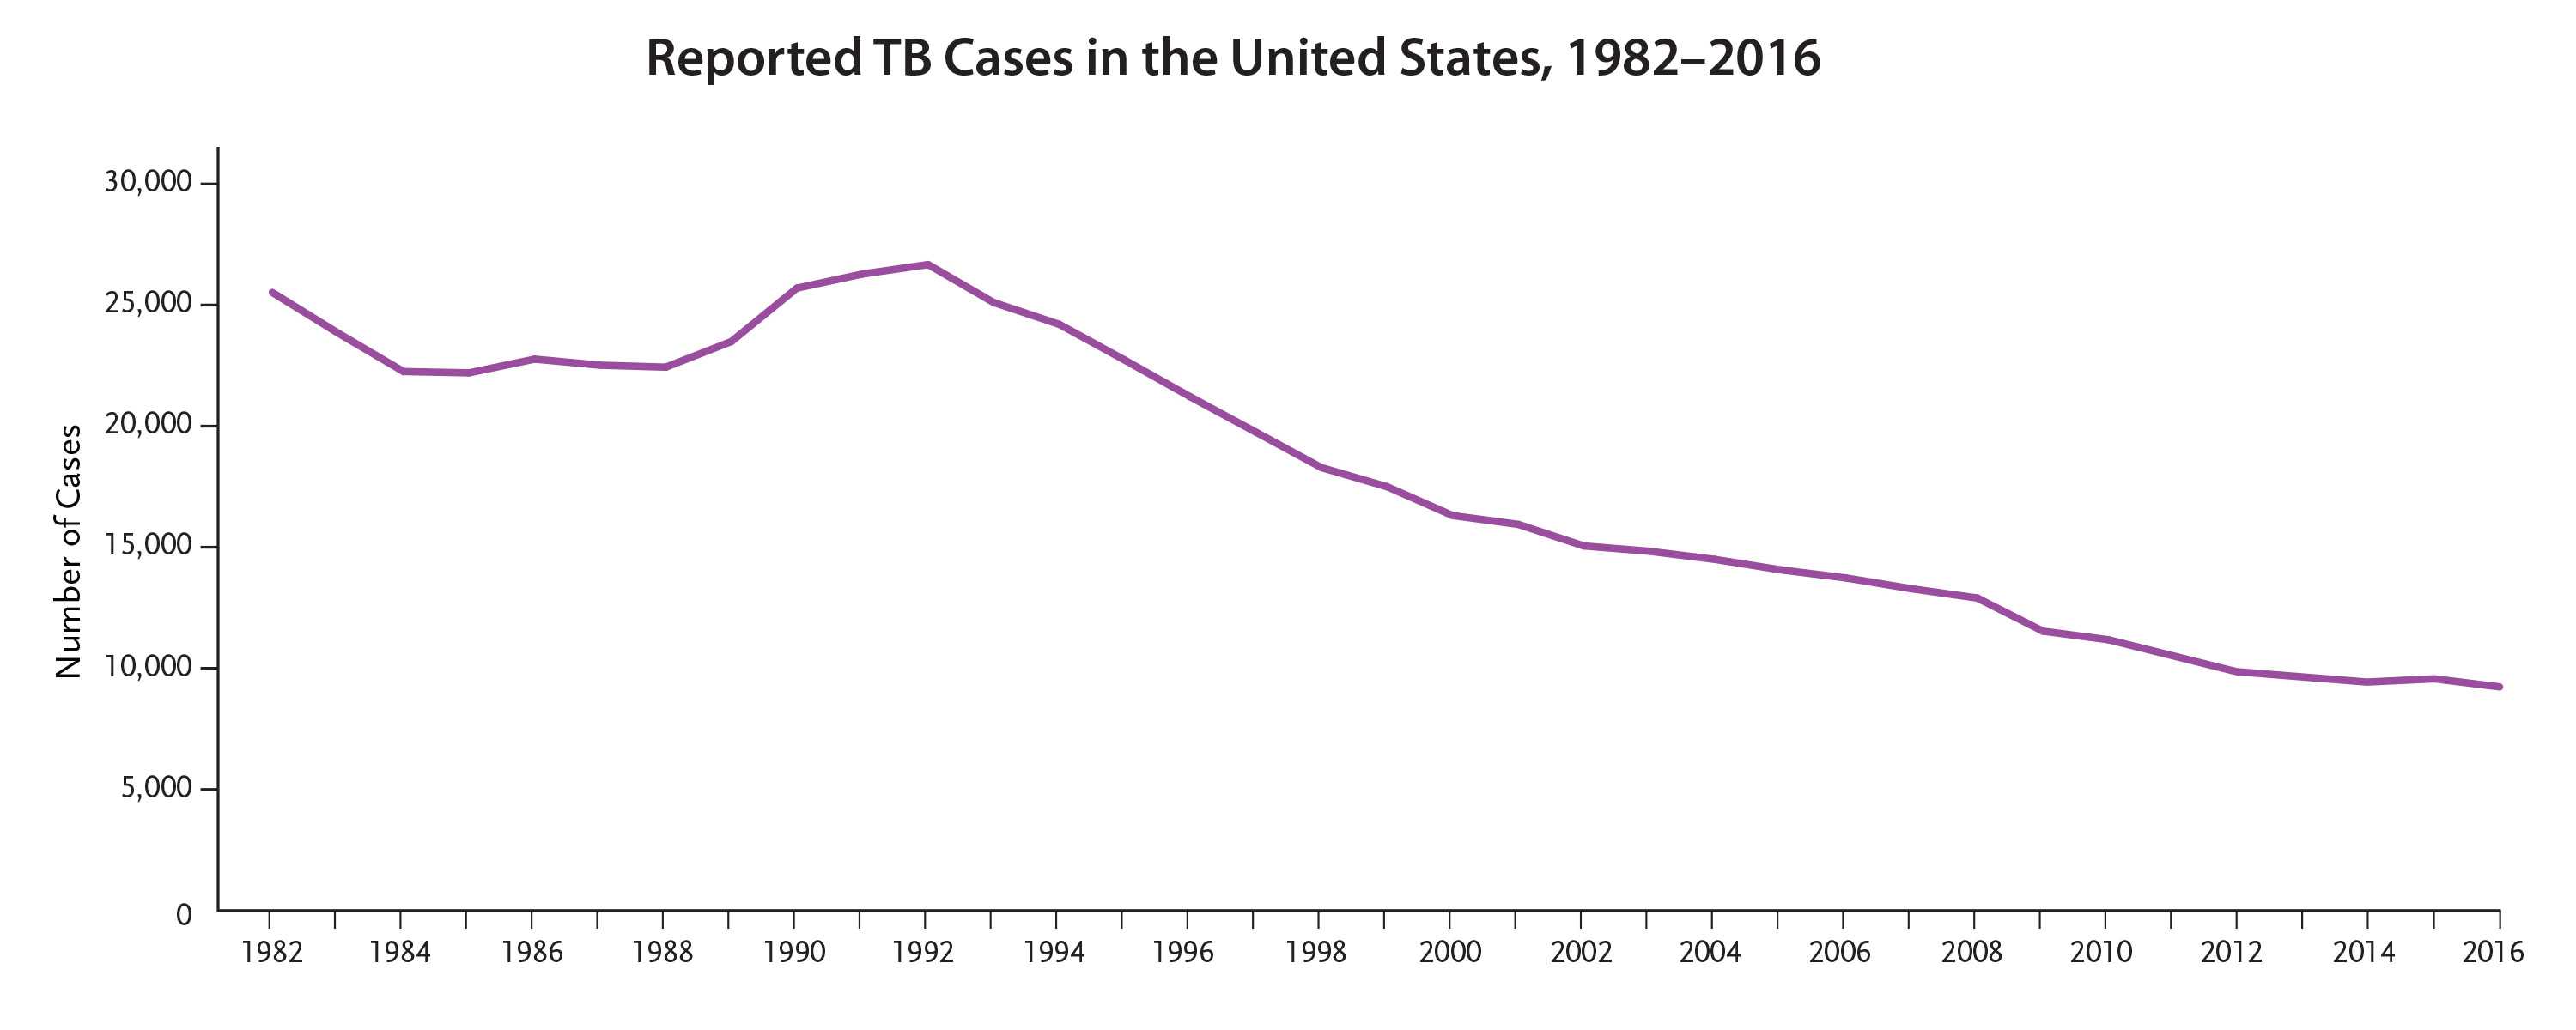 Reported TB Cases in the United States, 1982-2016
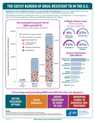
 “New Treatment for MDR-TB” with Dr. Sundari Mase


Graphics
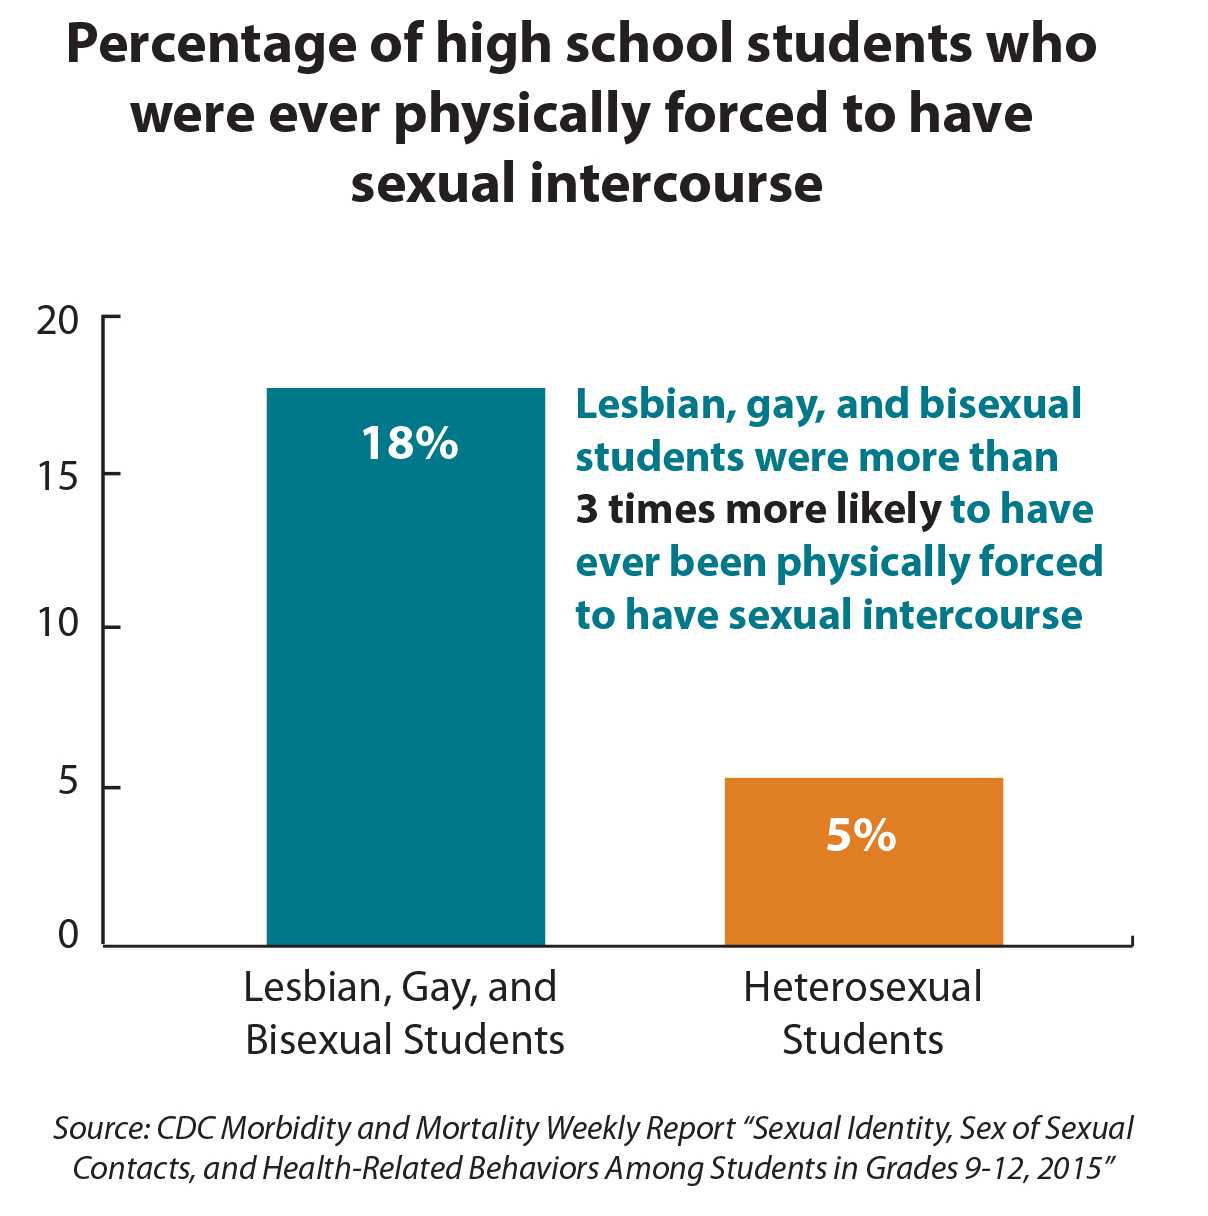 Percentage of Students Who Were Ever Physically Forced to Have Sexual Intercourse
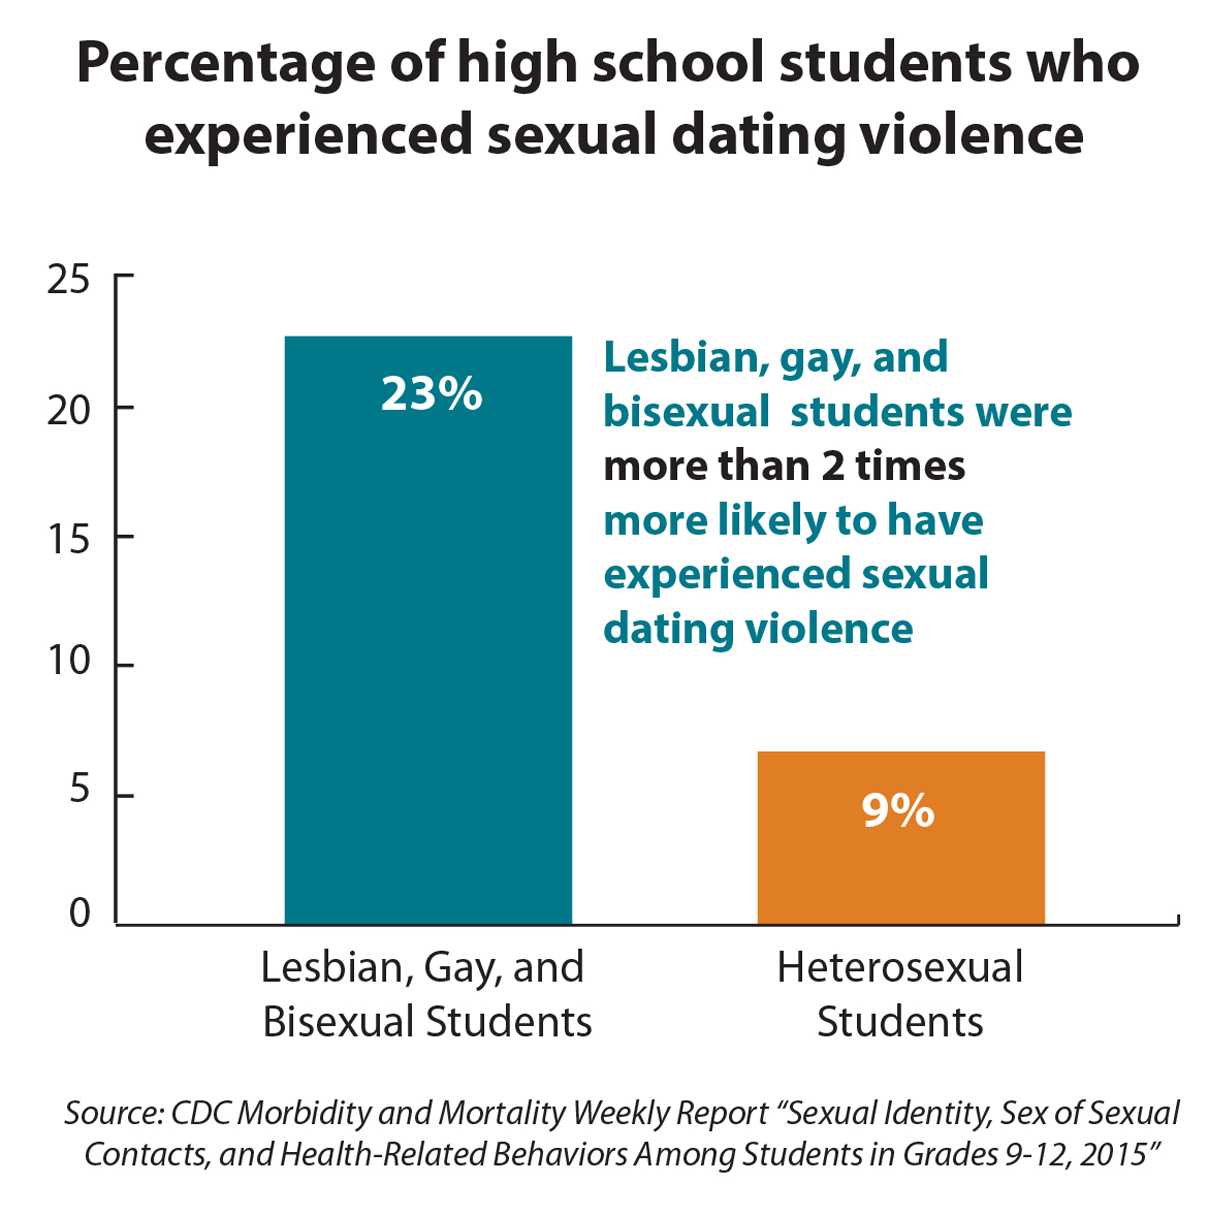 Percentage of Students Who Experienced Sexual Dating Violence
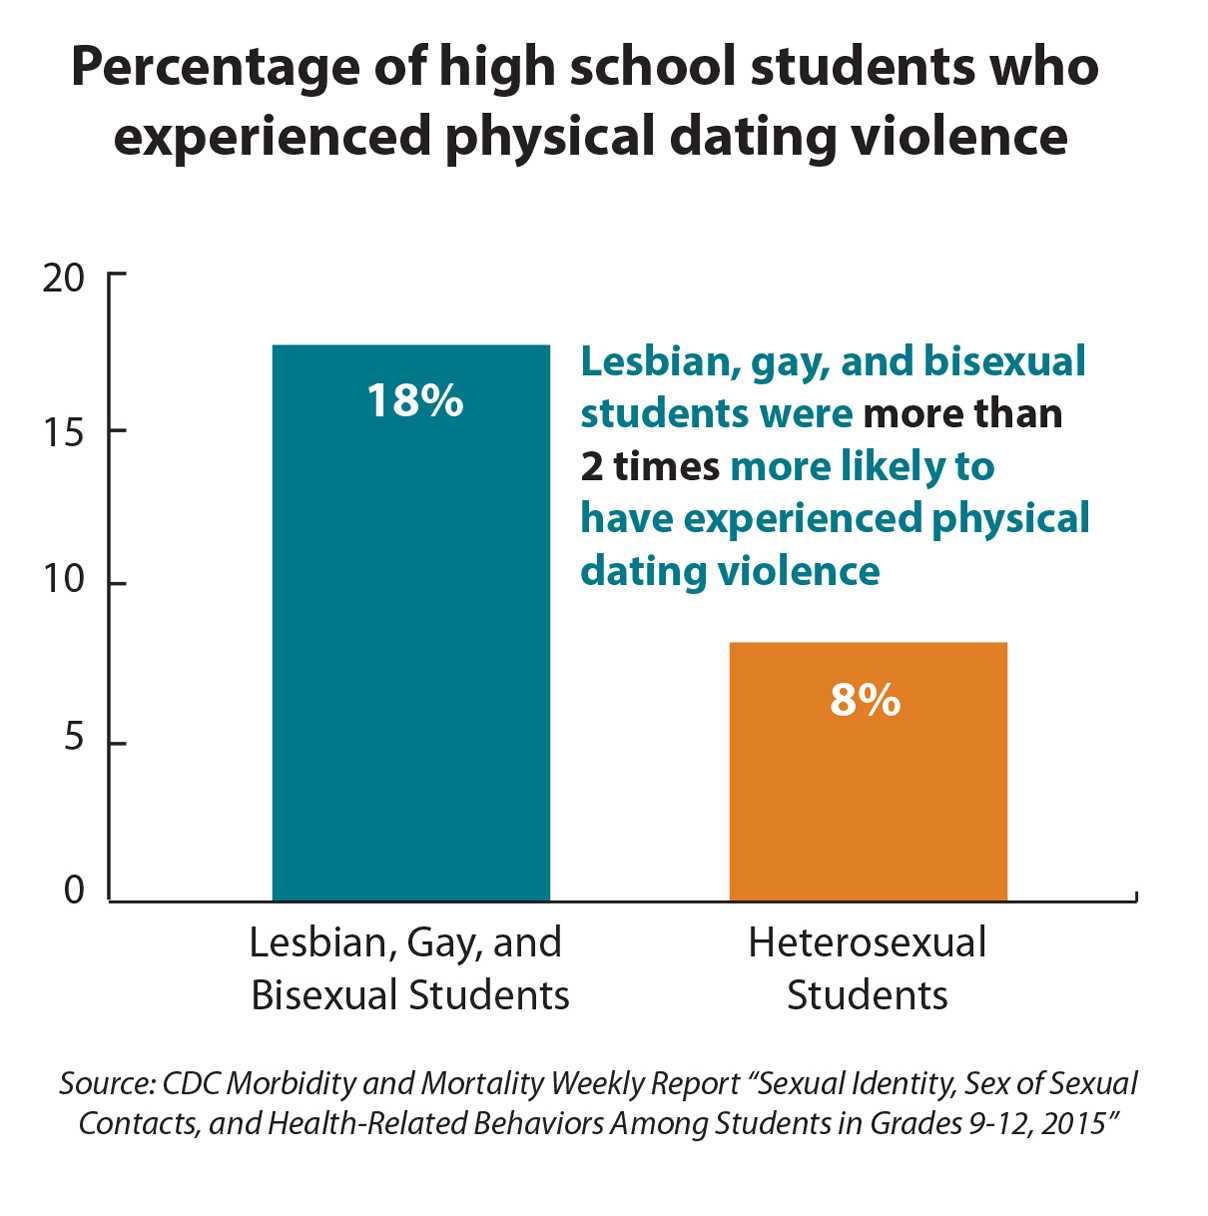 Percentage of Students Who Experienced Physical Dating Violence
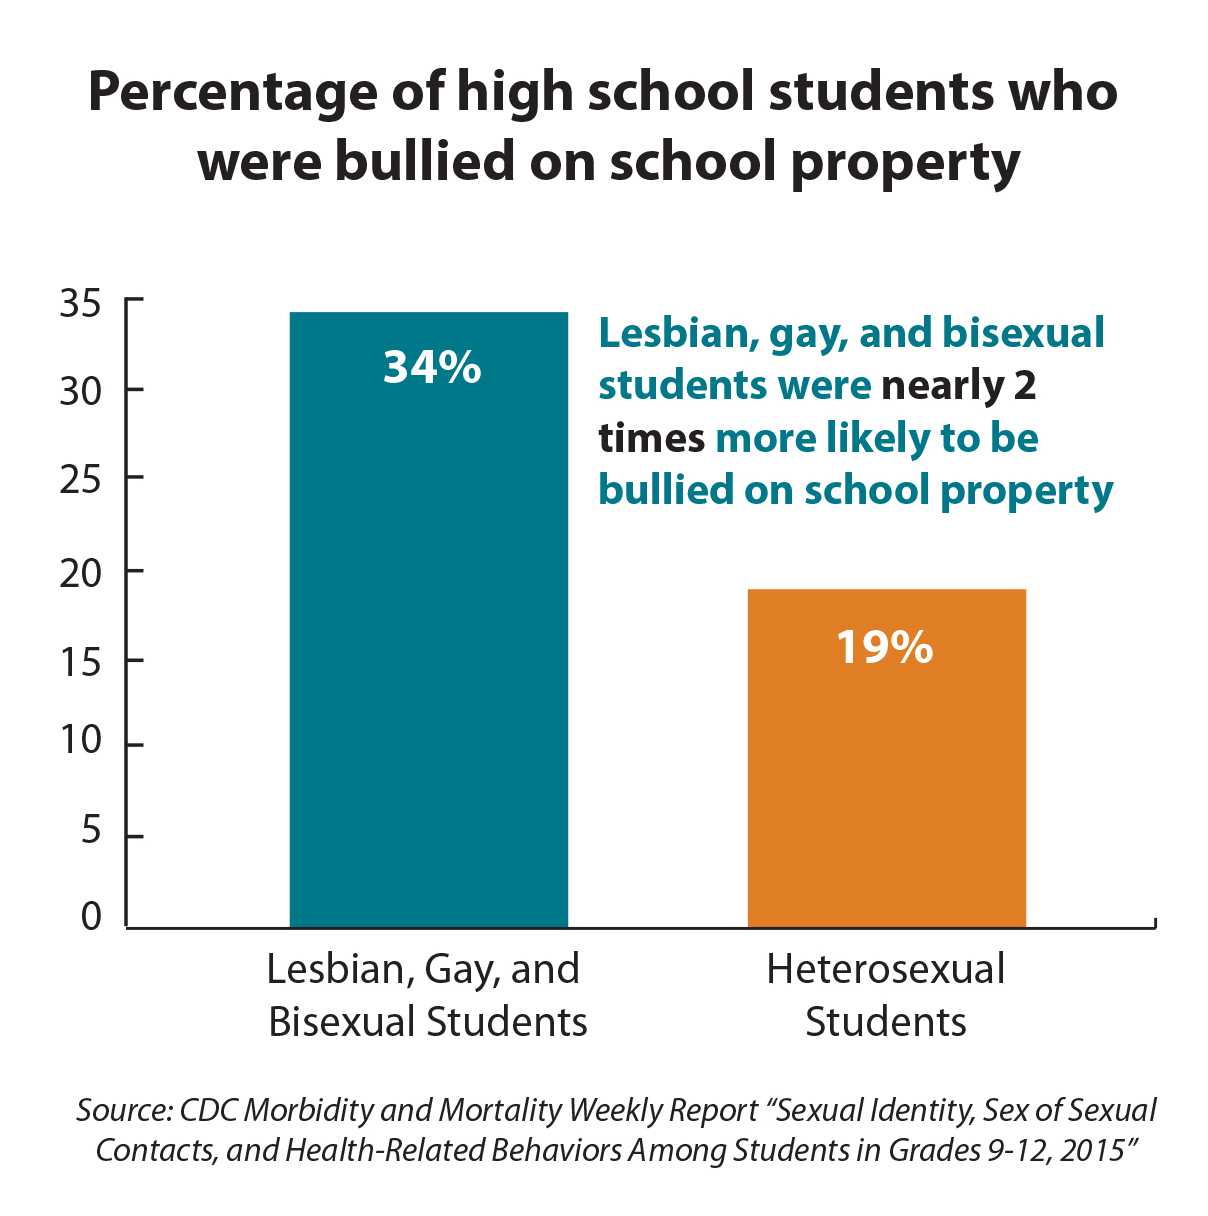 Percentage of Students Who Were Bullied on School Property
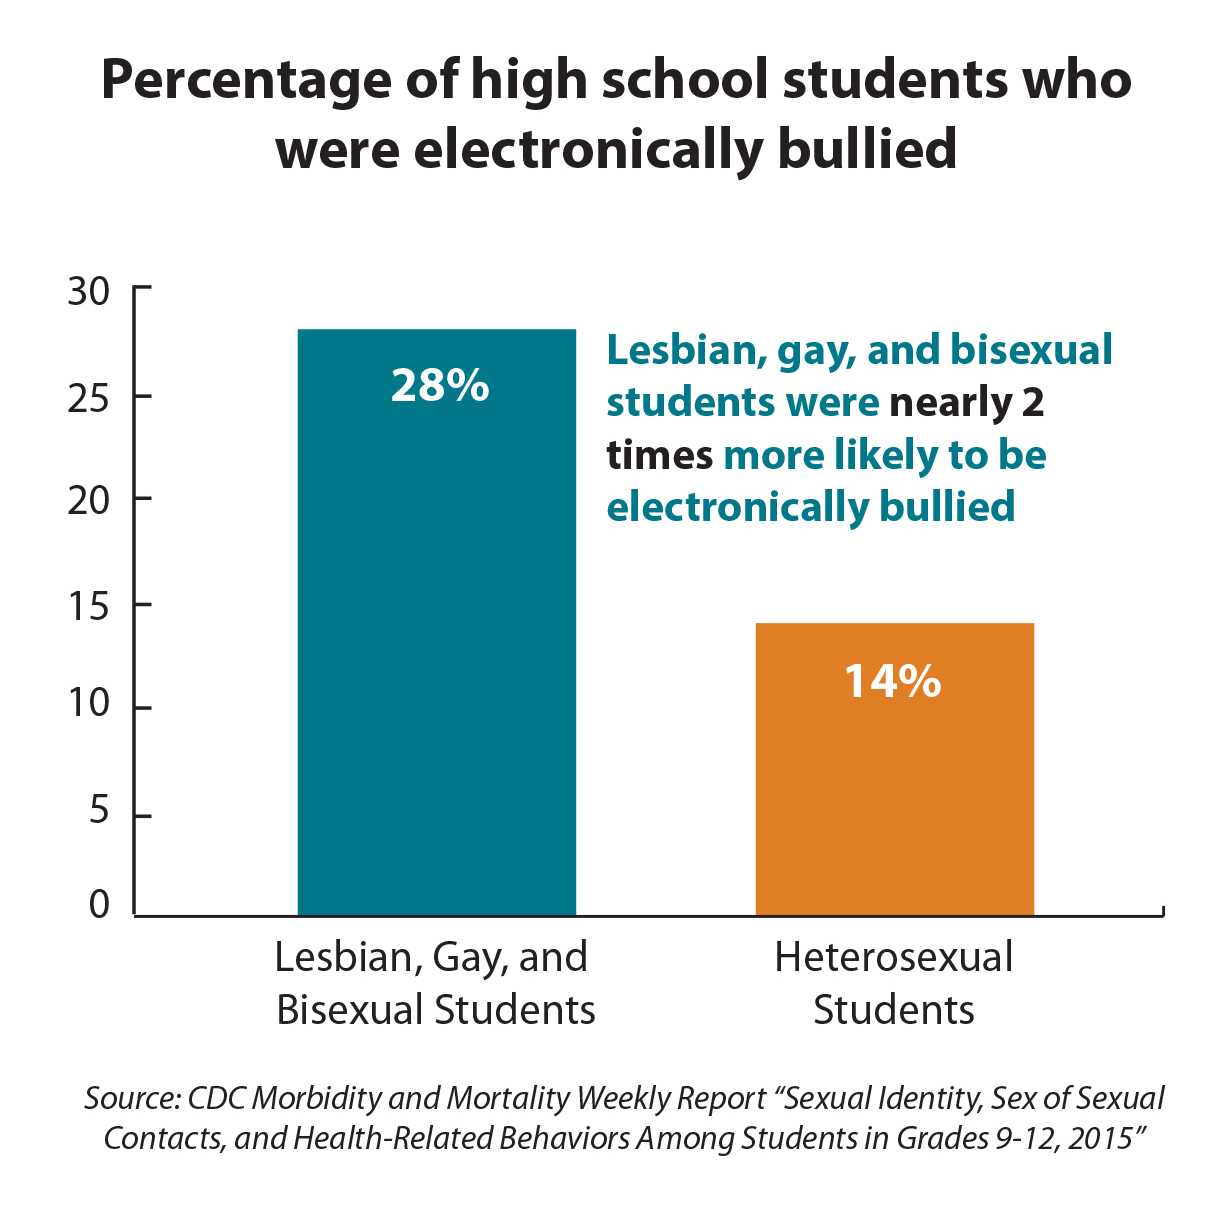 Percentage of Students Who Were Electronically Bullied
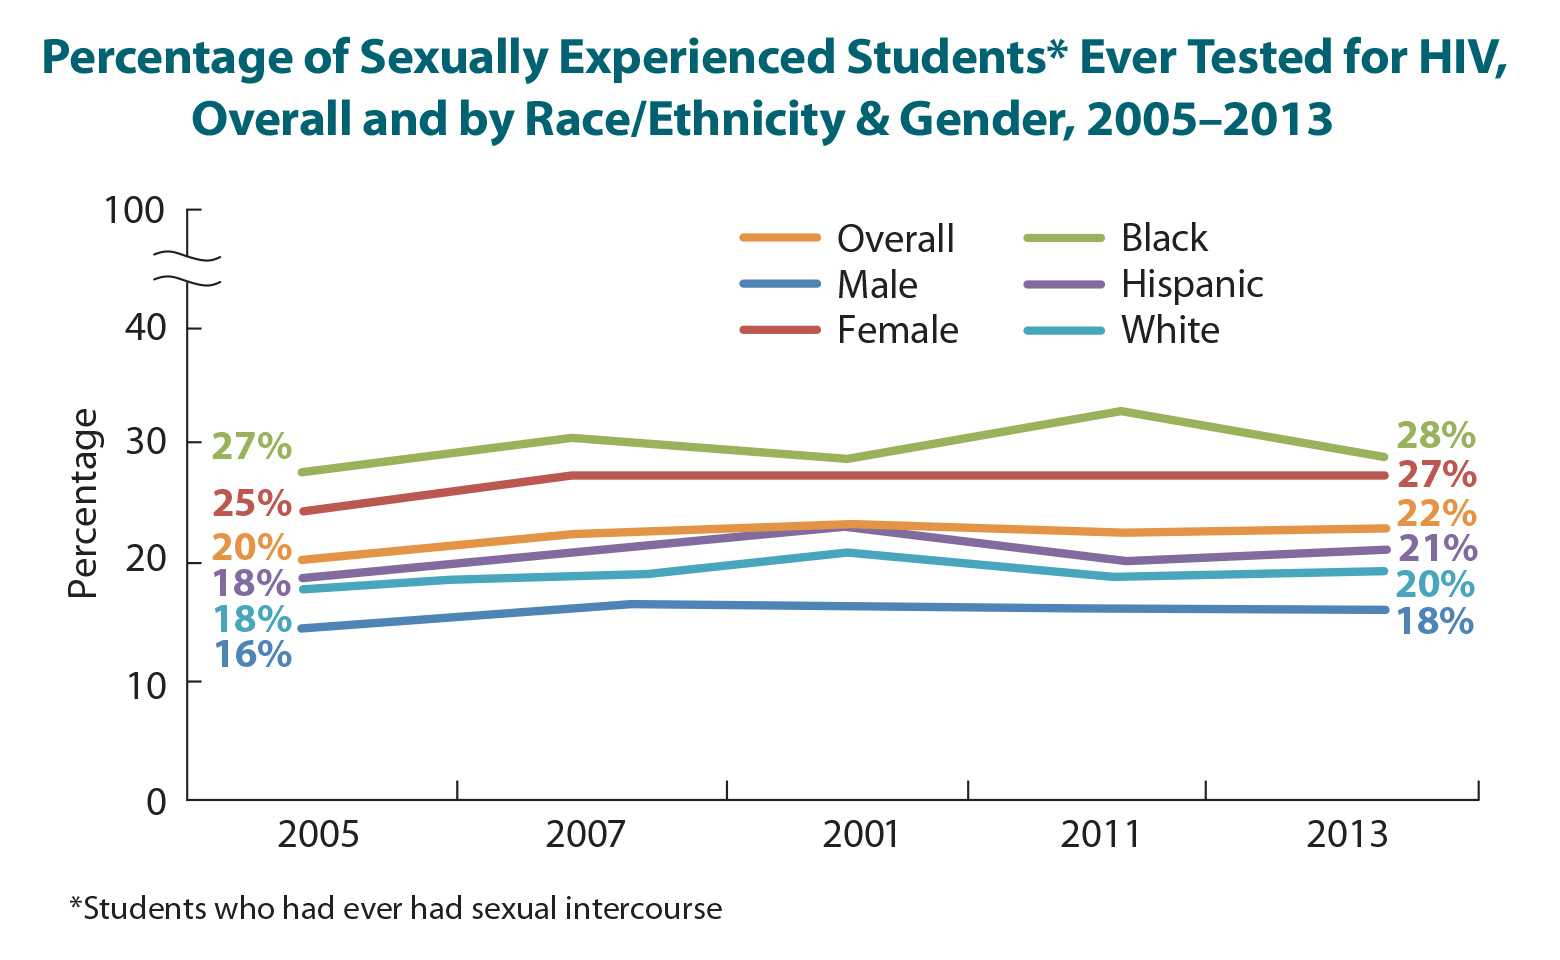 Percentage of Sexually experienced youth HIV tested
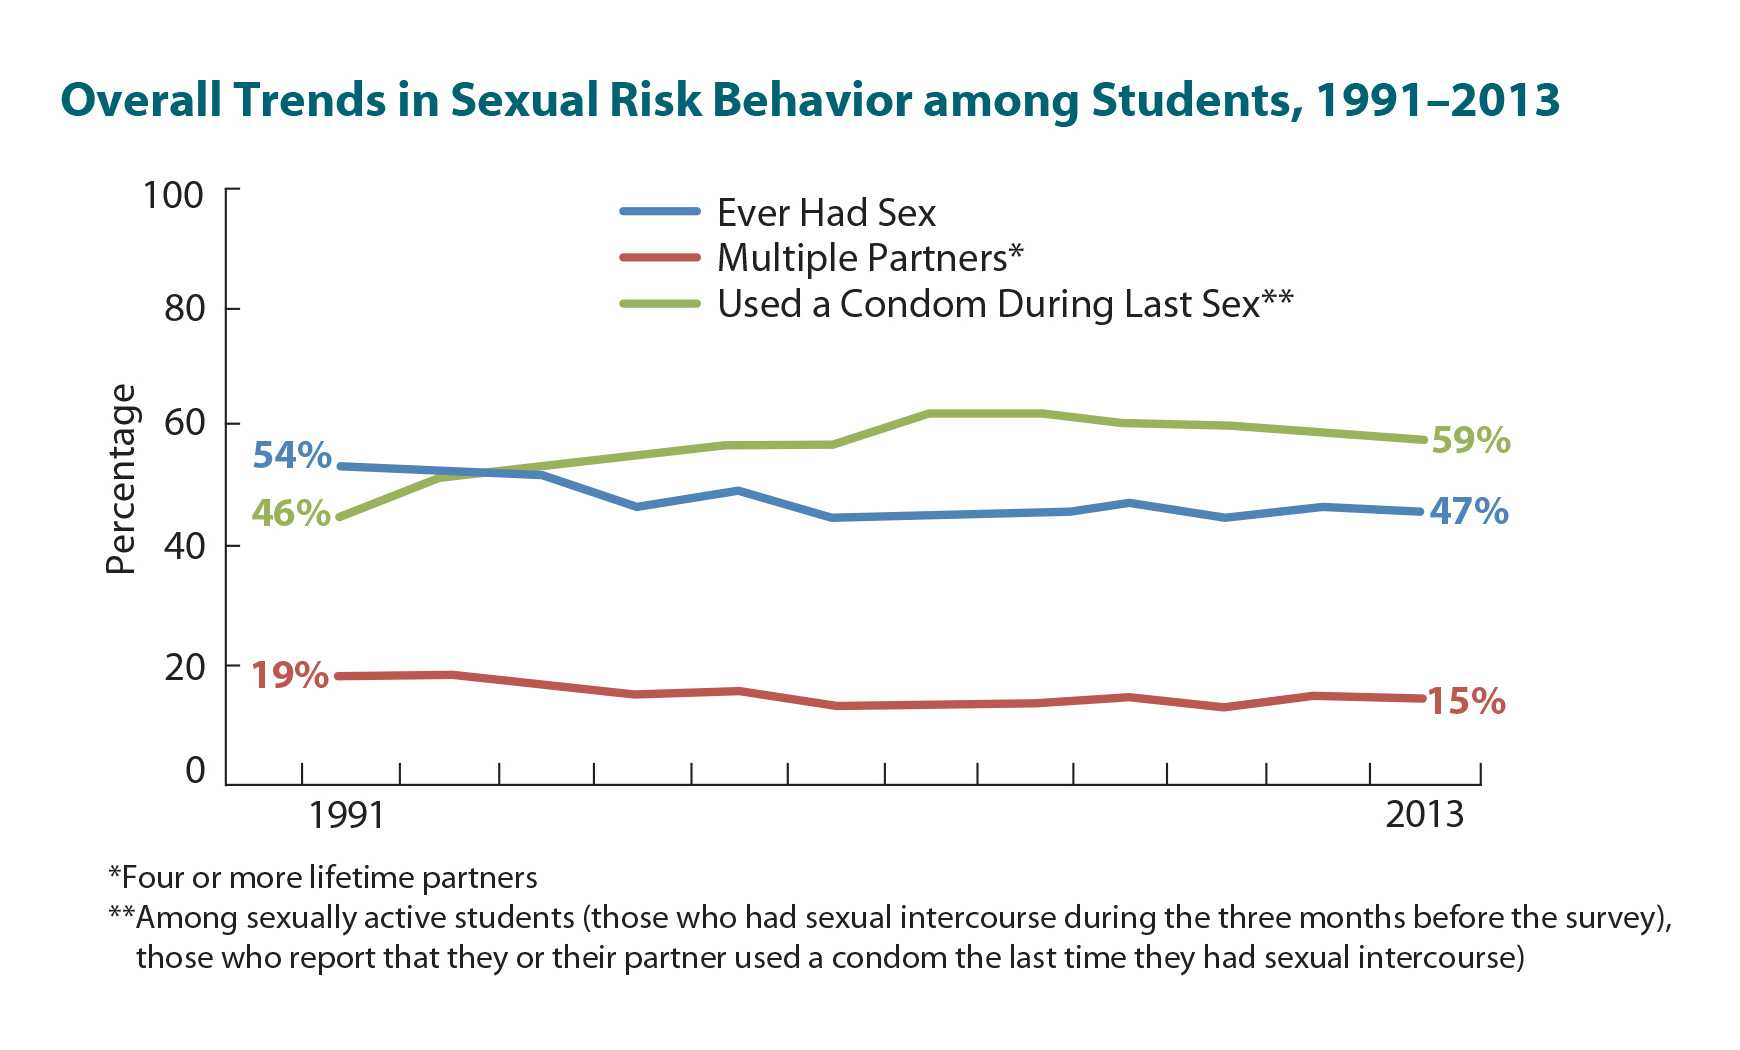 Overall Trends in Sexual Risk Behavior
Video
 “Youth Behaviors and HIV Risk” with Dr. Laura Kann

- Page last reviewed: September 26, 2017
- Page last updated: September 26, 2017
- Content source: