

Progress Slows Toward TB Elimination
 ShareCompartir
March 19, 2015 – Progress Slows as CDC and Public Health Partners Steer the U.S. Towards TB Elimination.
In advance of World TB Day, on March 24, CDC has released preliminary national surveillance data for 2014 reaffirming that TB control is working, and that we are steadily moving towards the elimination of this deadly disease. Data also suggest that progress is slowing, which is a reminder that TB should not be underestimated.
These data provide an important opportunity to shed light on this significant public health issue that still impacts thousands of people across the nation every year. Please see the media resources below to assist with your coverage.
Resources
- Media Summary: Trends in Tuberculosis – United States, 2014
- Fact Sheet: TB in the United States – A Snapshot, 2014
-
Background Materials:
- MMWR Full Report: “Trends in Tuberculosis – United States, 2014”
- Fact Sheet: TB Drug Resistance in the U.S.
Graphics: 2014 U.S. TB Surveillance Data
The following images and graphics highlight major findings from CDC’s analysis of 2014 national surveillance data. These high-resolution, public domain images are ready to download and print in your publication. Click on a graphic to see it in high-resolution.
These images are in the public domain and are thus free of any copyright restrictions. As a matter of courtesy, we ask that the content provider be credited and notified of any public or private usage of an image.
Please note that this resource is for reporters. If you are a member of the general public and seek additional information about TB, please visit www.cdc.gov/tb/. If you have additional questions, please call 1(800) CDC INFO or email cdcinfo@cdc.gov.
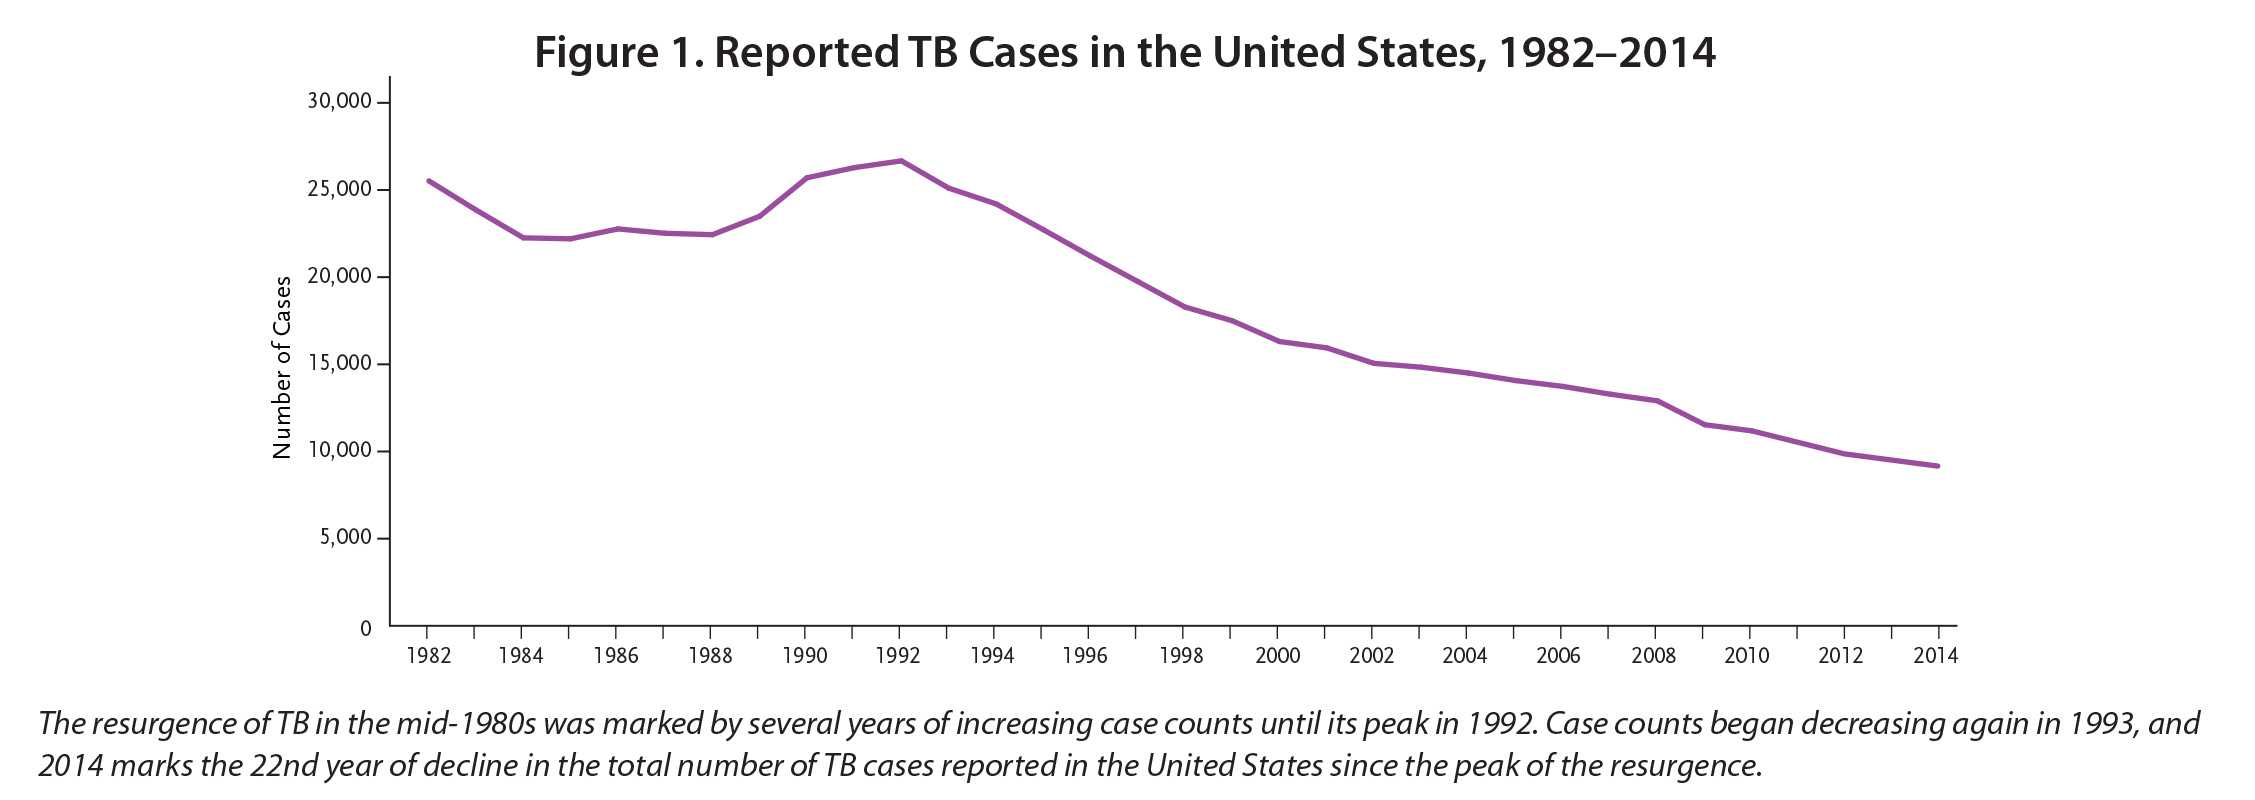 Reported TB Cases in the United States, 1982-2014
View High Resolution Version
Data for 2014 marks the 22nd year of decline in the total number of TB cases reported in the United States since the peak of a resurgence of the disease in 1992. Rates also continued to decline; however, 2013-2014 was the smallest decline in rates since 1992.
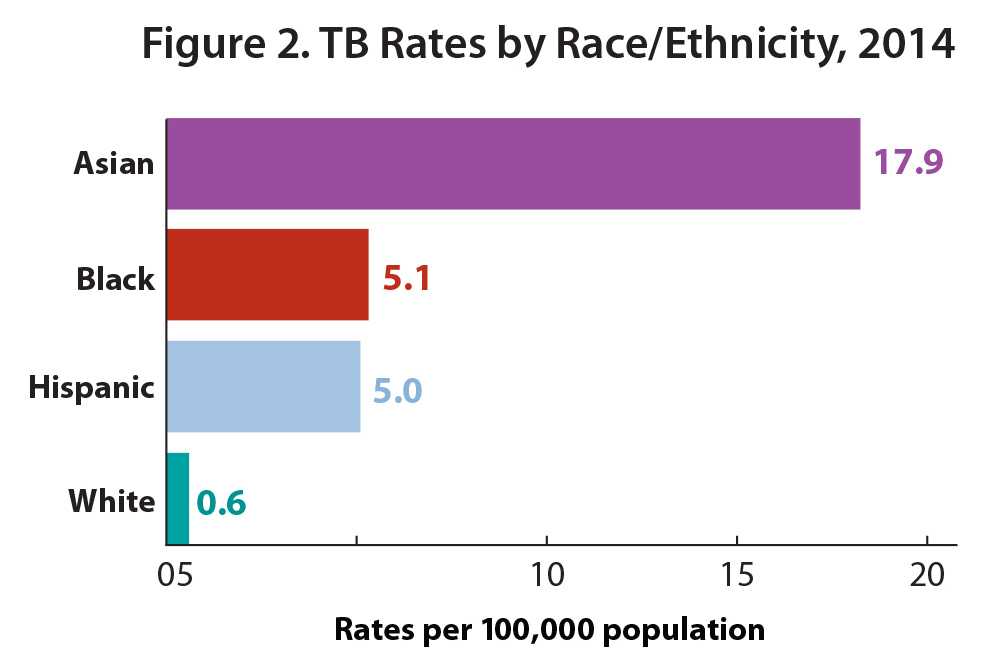 TB Rates by Race/Ethnicity, 2014
View High Resolution Version
Although TB rates declined among all racial/ethnic groups, TB rates among racial/ethnic minorities are much higher than those of whites. Rates for Asians (18.7/100,000), blacks (5.3), and Hispanics (5.0) were 26, seven, and seven times higher than among whites (0.7), respectively.
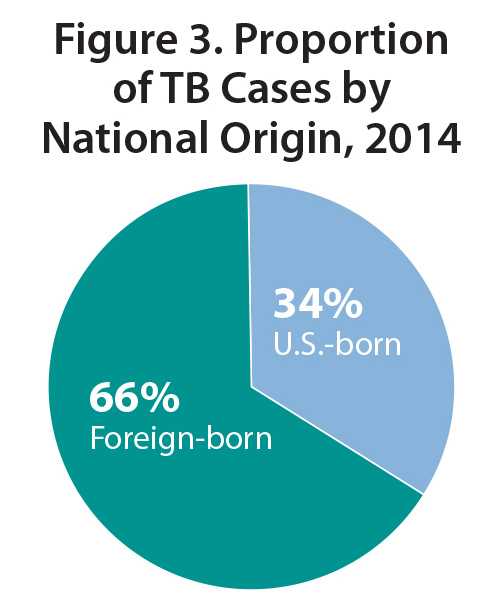 Proportion of TB Cases by National Origin, 2014
View High Resolution Version
Despite declines in the rates of TB among both foreign- and U.S.-born individuals, the TB rate among foreign-born persons was 13 times higher than among U.S.-born persons.
###

- Page last reviewed: March 19, 2015
- Page last updated: March 19, 2015
- Content source: