

Take Charge. Take the Test.
 ShareCompartir
Campaign Images and Graphics with Key Data for HIV Among African American Women
High-resolution, downloadable graphics
Click on a graphic to see it in high-resolution.
Images and graphics on this page are available for download. These high-resolution, public domain images are ready to print in your publication.
These images are in the public domain and are thus free of any copyright restrictions. As a matter of courtesy, we request that the content provider be credited and notified of any public or private usage of an image.
Take Charge. Take the Test – Individual Campaign Ads
 View High Resolution Version
You know him. But you can’t know everything. Get a free HIV test. To learn more about free HIV testing or to find an HIV testing location near you, call 1(800) CDC-INFO (232-4636) or visit hivtest.org/takecharge.
 View High Resolution Version
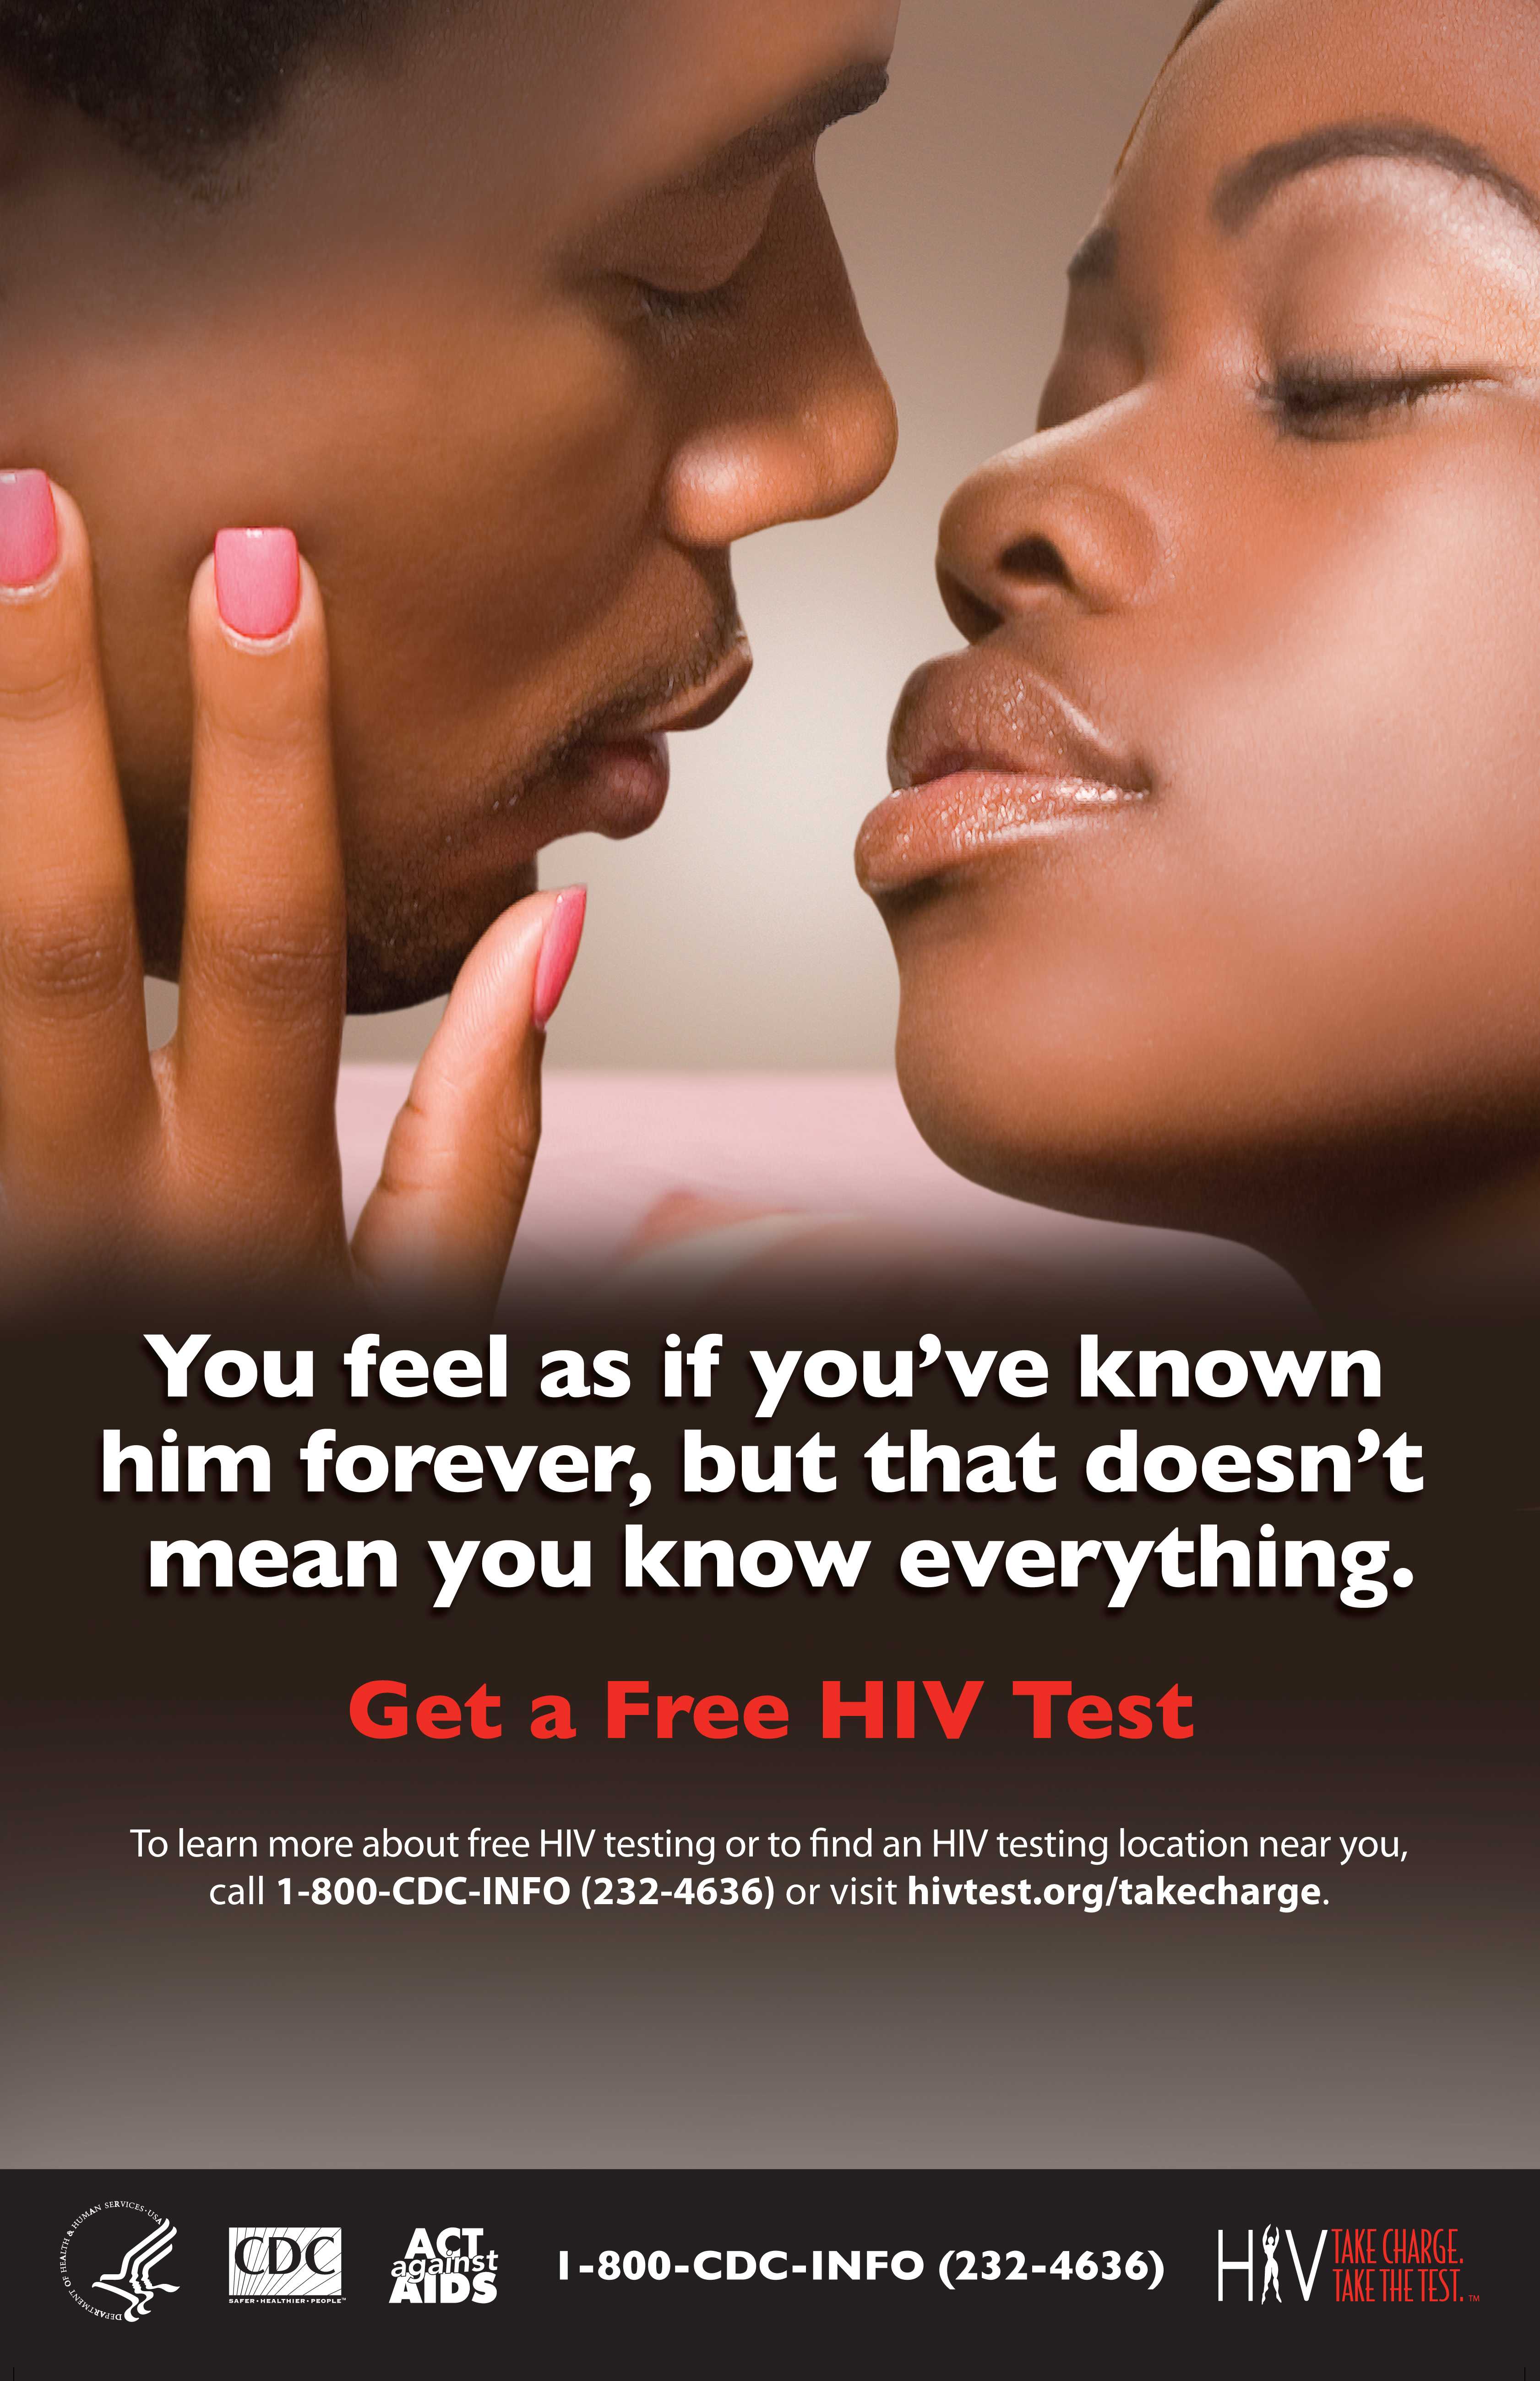
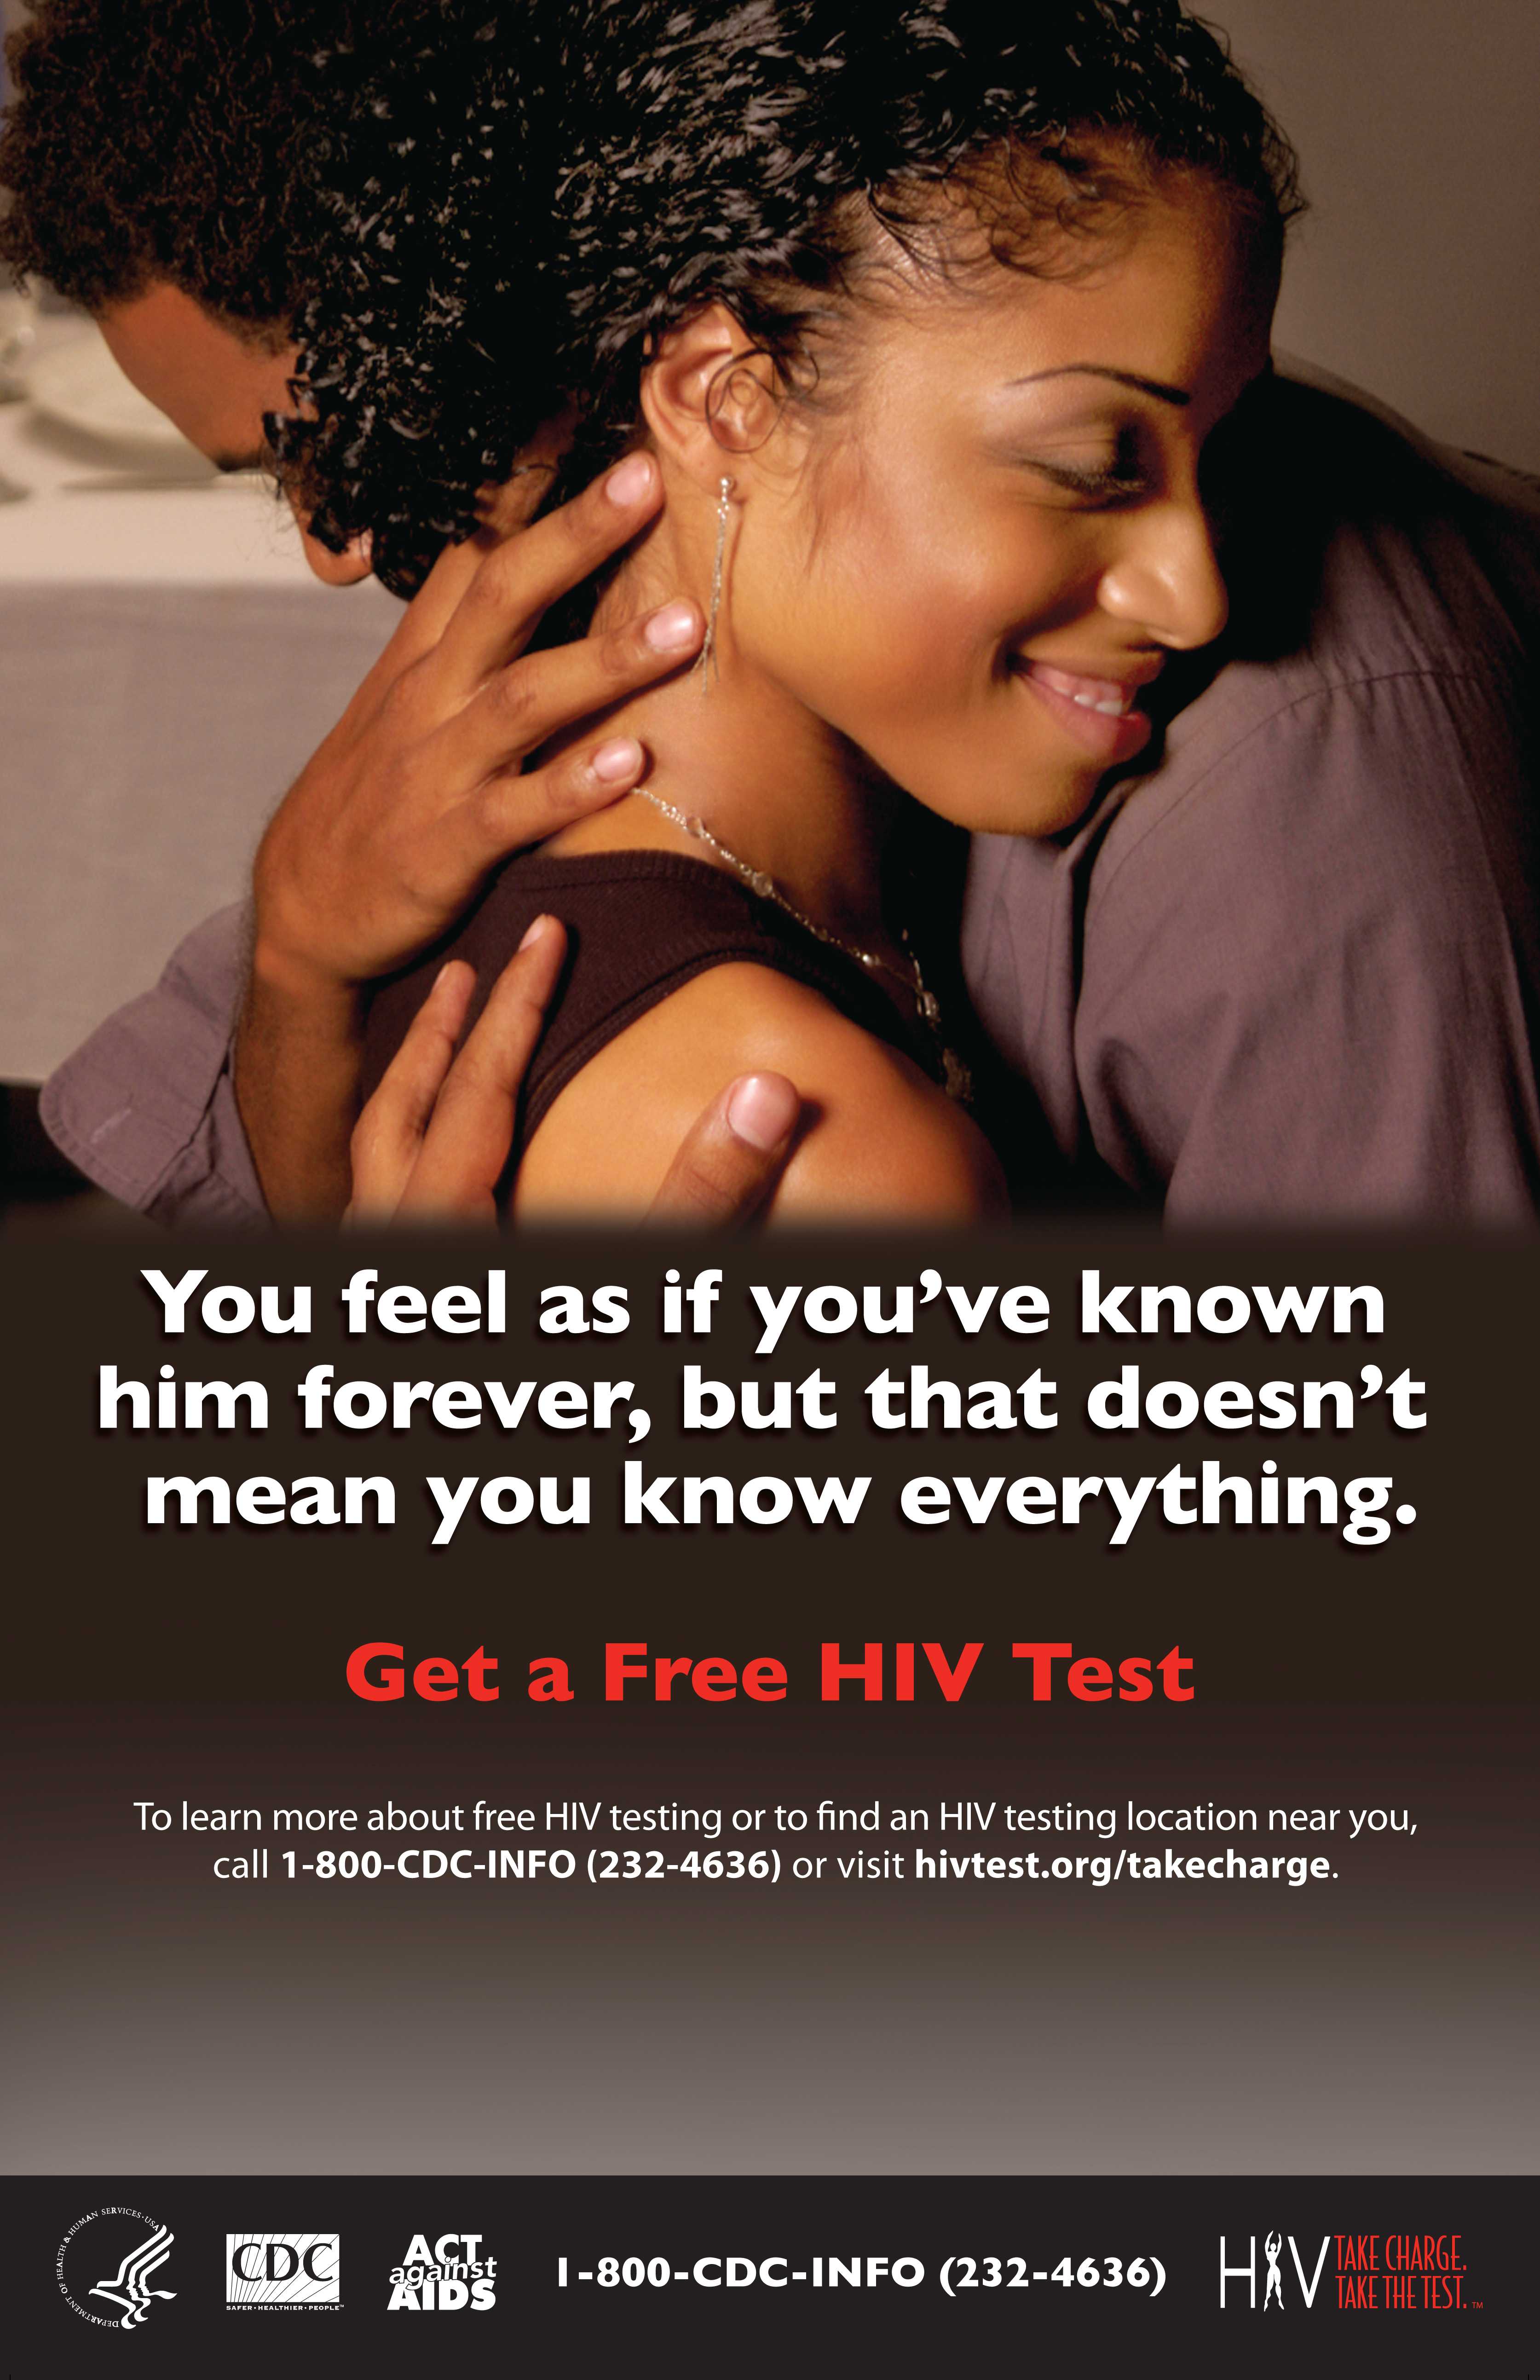
You feel as if you’ve known him forever, but that doesn’t mean you know everything. Get a free HIV test. To learn more about free HIV testing or to find an HIV testing location near you, call 1(800) CDC-INFO (232-4636) or visit hivtest.org/takecharge.
African American Women Related Graphics
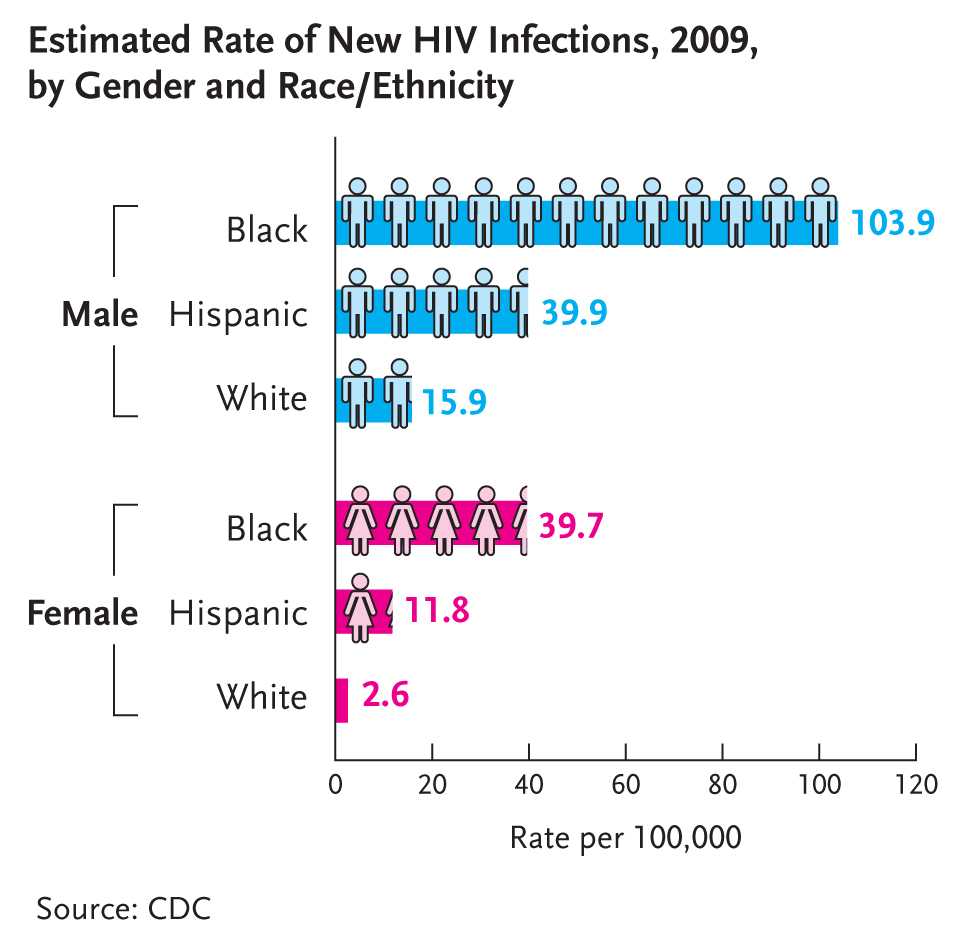 Estimated rate of New HIV Infections, 2009, by Gender and Race/Ethnicity
View High Resolution Version
This graph shows the estimated rate of new HIV infections by gender and race/ethnicity in 2009. It highlights that black women are more affected by HIV than women of all other races, accounting for nearly 60 percent (57 percent) of all new HIV infections among women in 2009. The HIV infection rate among black women was 15 times that of white women (39.7 v. 2.6 per 100,000).
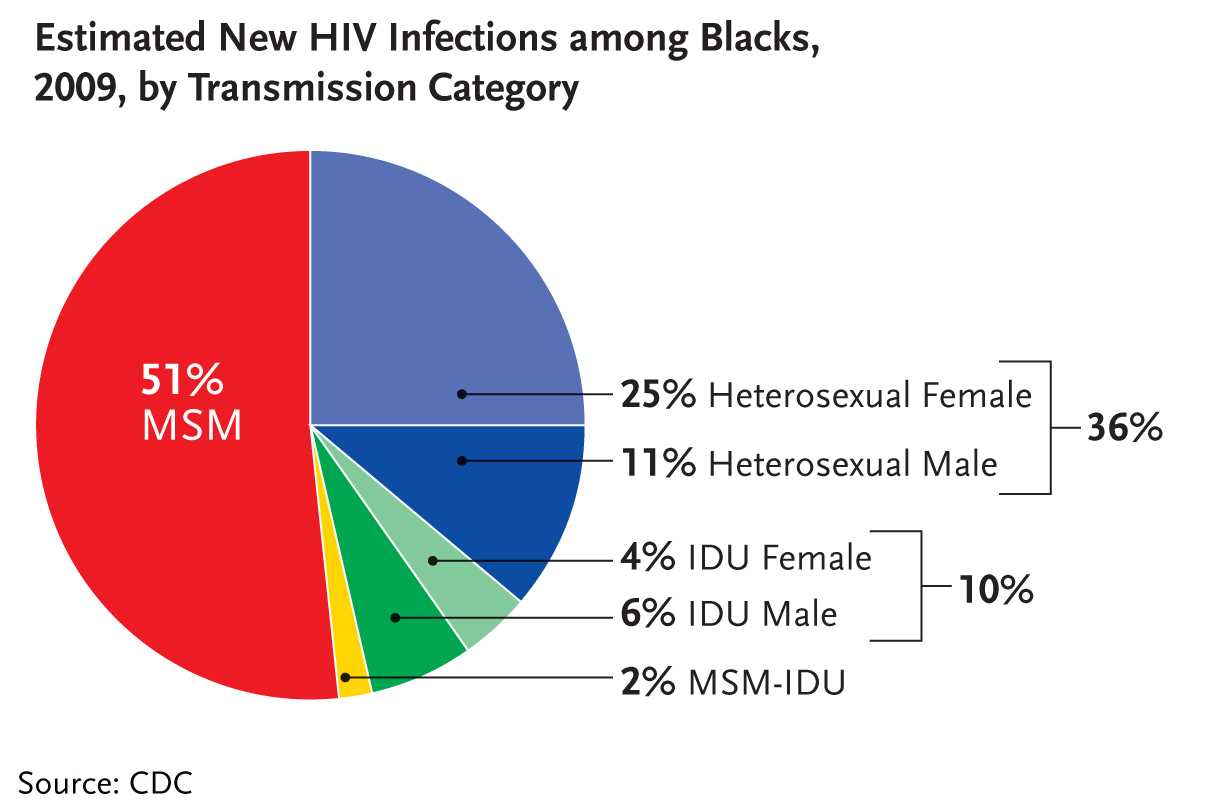 Estimated New Infections among Blacks, 2009, by Transmission Category
View High Resolution Version
This pie chart shows estimated new HIV infections among African Americans by transmission category for 2009. It highlights that a quarter of all new HIV infections among African Americans occurred among heterosexual black women– the second highest proportion after black men who have sex with men.
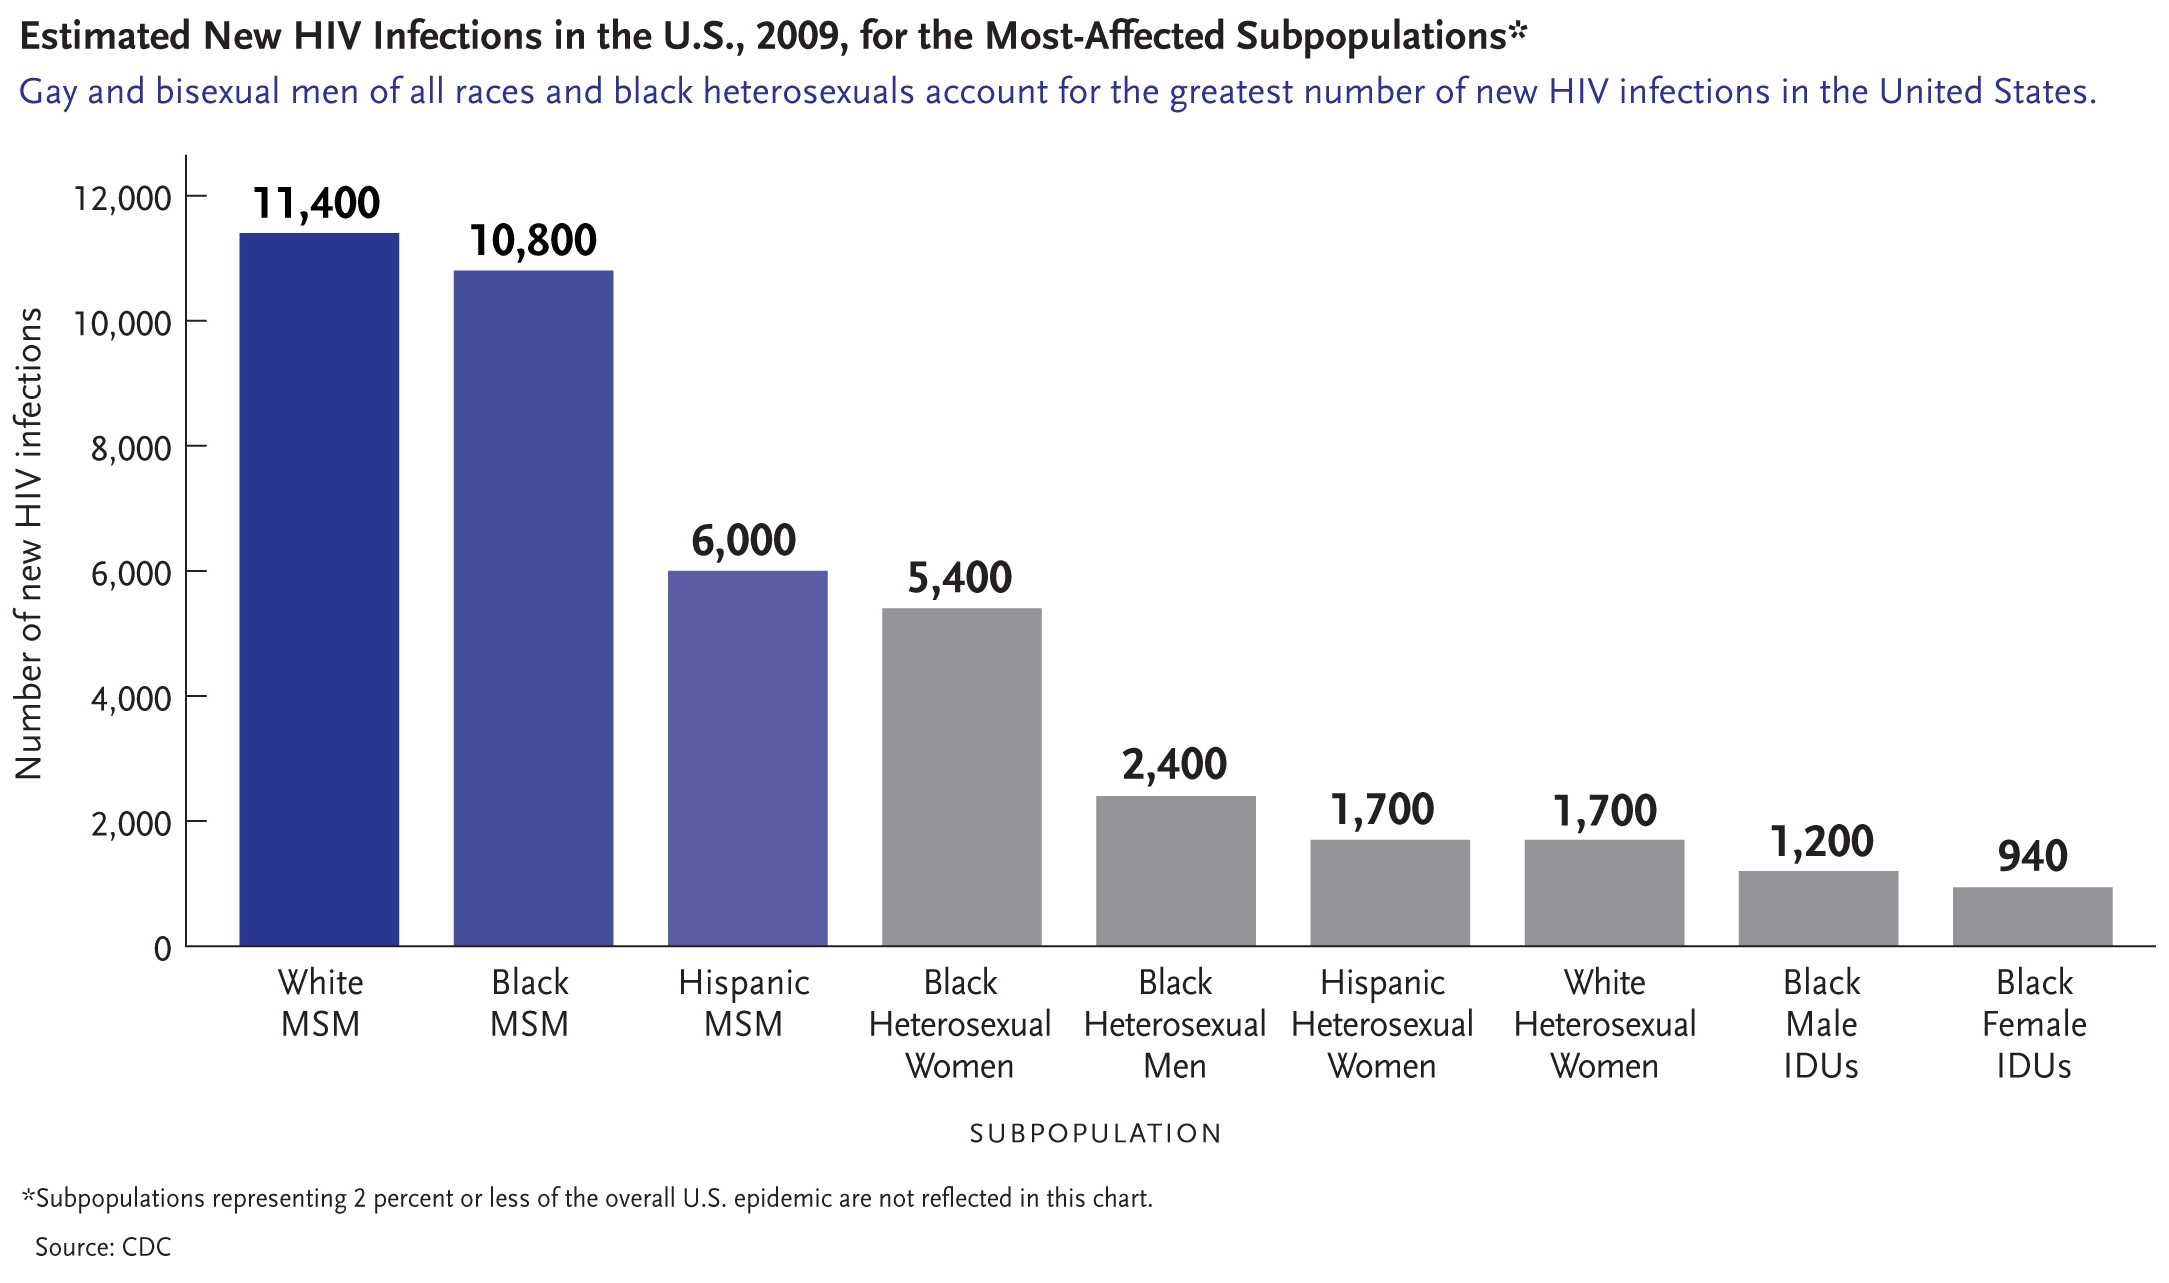 Estimated New HIV Infections in the US, 2009, for the Most Affected Subpopulations
View High Resolution Version
This bar chart shows those populations who are most affected by HIV in the US based on estimated numbers of new HIV infections for 2009. Black heterosexual women accounted for 5,400 new HIV infections and account for the second greatest number of new HIV infections in the US, after gay and bisexual men of all races.
 Estimated New Infections among Heterosexuals, 2009, by Gender and Race/Ethnicity
View High Resolution Version
This graph shows the estimated number of new HIV infections among heterosexuals by gender and race/ethnicity in 2009. In that year, more than twice as many new HIV infections occurred among heterosexual black women than among heterosexual black men (5,400 vs. 2,400).

- Page last reviewed: March 8, 2012
- Page last updated: December 20, 2013
- Content source: