

Graphics to Accompany CDC’s New Approach to HIV Prevention Funding
 ShareCompartir
Current picture of the U.S. epidemic and proportion of funding
Click on the graphic to view it in high resolution.
Images and graphics highlighting major findings of the report are available for download. These high-resolution, public domain images are ready to print in your publication.
These images are in the public domain and are thus free of any copyright restrictions. As a matter of courtesy, we request that the content provider be credited and notified of any public or private usage of an image.
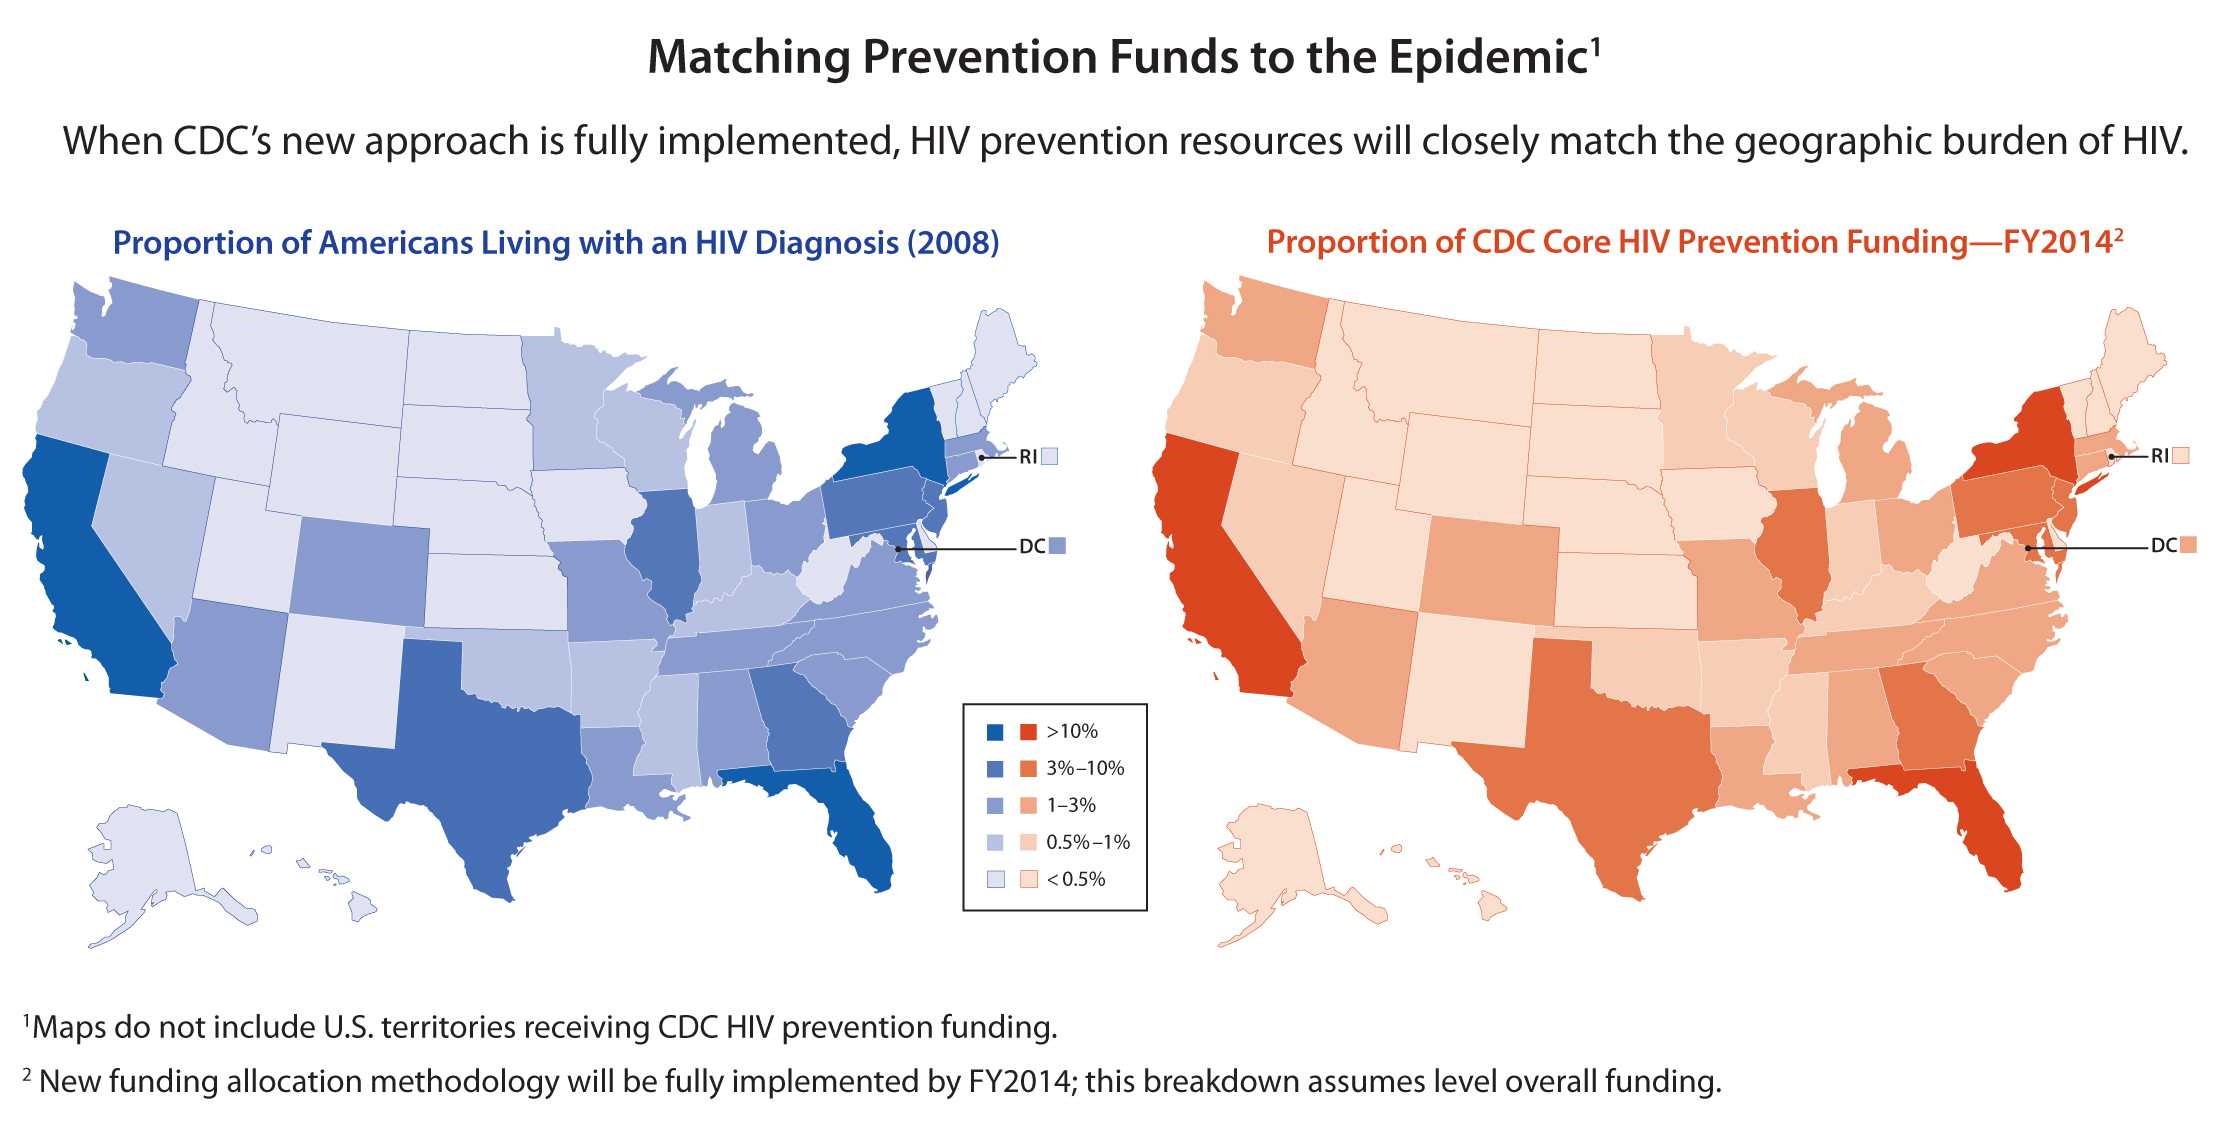
The map of the left is a map of the United States showing the proportion of Americans living with an HIV diagnosis in 2008 by state. The map on the right is a map of the United States that shows proportion of prevention funding by state for FY2014. View High Resolution Version

- Page last reviewed: June 30, 2011
- Page last updated: December 27, 2013
- Content source: