

Health Equity Matters Newsletter
 ShareCompartir
Statistics Highlight
- In 2015, mortality from alcohol-induced causes reached the highest rate during 1999–2015 of 9.1 deaths per 100,000 U.S. standard population.
- Alcohol-induced death rates for the Hispanic population remained the highest (9.9 per 100,000 U.S. standard population), followed by the non-Hispanic white population (9.6).
- For the non-Hispanic black population, the alcohol-induced death rate decreased 33% from 1999 to 2015, while the rate increased by 50% during the same period for the non-Hispanic white population. Overall, from 1999 to 2015, mortality from alcohol-induced causes increased 28% (7.1 to 9.1).
- The overall age-adjusted rate of motor vehicle traffic deaths in the United States decreased 25% from 14.6 deaths per 100,000 population in 2005 to 10.9 in 2015.
- During this period, the rate declined in each of the county groupings, with the largest decline of 26% in the large fringe metropolitan and micropolitan counties and the smallest decline of 20% in rural counties.
- In both 2005 and 2015, the rates for motor vehicle traffic deaths were higher in nonmetropolitan areas than in metropolitan areas.
- In 2015, the age-adjusted rate in rural counties was nearly three times the rate for large central metropolitan counties (23.0 compared with 7.9 per 100,000).
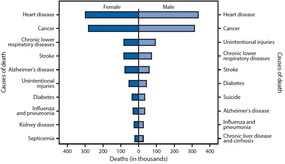
- In 2015, a total of 1,339,226 deaths among females and 1,373,404 deaths among males occurred.
- Heart disease and cancer were the top two causes of death for both females and males; other leading causes varied in rank by sex.
- The 10 leading causes of death accounted for approximately three-quarters of all deaths.
- In 2015, the age-adjusted Alzheimer’s disease death rate among persons aged ≥65 years in the United States was 231.0 per 100,000 population.
- The five states with the highest age-adjusted death rates for Alzheimer’s disease were South Carolina (362.8), Washington (349.6), Mississippi (346.5), Tennessee (340.8), and Louisiana (333.6).
- New York had the lowest rate (99.0), followed by Maryland (128.2), Alaska (131.7), Connecticut (149.3), and the District of Columbia (152.2).
- Page last reviewed: August 29, 2017
- Page last updated: August 29, 2017
- Content source: