

Previous Health Equity Matters Newsletter
 ShareCompartir
Statistics Highlight
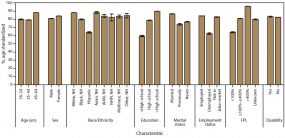
- In 2014, health insurance coverage and other health care access measures varied substantially by state, state Medicaid expansion status, expanded geographic region (i.e., states categorized geographically into nine regions), and federal poverty level (FPL) category.
- The prevalence of insurance coverage varied by approximately 25 percentage points among racial/ethnic groups (range: 63.9% among Hispanics to 88.4% among non-Hispanic Asians) and by approximately 32 percentage points by FPL category (range: 64.2% among adults with household income <100% of FPL to 95.8% among adults with household income >400% of FPL).
- The prevalence of unmet health care need because of cost varied by nearly 14 percentage points among racial/ethnic groups (range: 11.3% among non-Hispanic Asians to 25.0% among Hispanics), by approximately 17 percentage points among adults with and without disabilities (30.8% versus 13.7%), and by approximately 28 percentage points by FPL category (range: 5.3% among adults with household income >400% of FPL to 32.9% among adults with household income <100% of FPL).
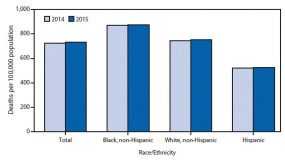
- From 2014 to 2015, the age-adjusted death rate for the total U.S. population increased 1.2% from 724.6 to 733.1 per 100,000 population.
- The rate increased 0.6% from 870.7 to 876.1 for non-Hispanic blacks and 1.4% from 742.8 to 753.2 for non-Hispanic whites. The rate for Hispanic persons did not change significantly.
- The highest rate was recorded for the non-Hispanic black population, followed by the non-Hispanic white and Hispanic populations.
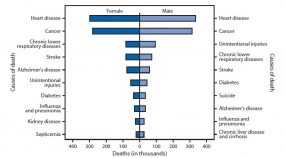
- In 2015, a total of 1,339,226 deaths among females and 1,373,404 deaths among males occurred.
- Heart disease and cancer were the top two causes of death for both females and males; other leading causes varied in rank by sex.
- The 10 leading causes of death accounted for approximately three-quarters of all deaths.
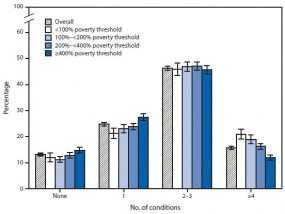
- For the period 2013–2015, 13% of adults aged ≥65 years reported having none of 10 selected diagnosed chronic conditions; 25% had one, 46% had two or three, and 16% had four or more of the conditions.
- No differences by poverty status were observed among those who reported having two or three conditions, but those in the lowest income group (<100% of the poverty threshold) were less likely to have none or only one of the chronic conditions compared with those in the highest income group (≥400% of the poverty threshold).
- Those in the lowest income group also were more likely to have four or more conditions when compared with those in the highest income group (21% compared with 12%).
- Page last reviewed: May 25, 2017
- Page last updated: May 25, 2017
- Content source: