

The Continuum of Pandemic Phases - 508
 ShareCompartir
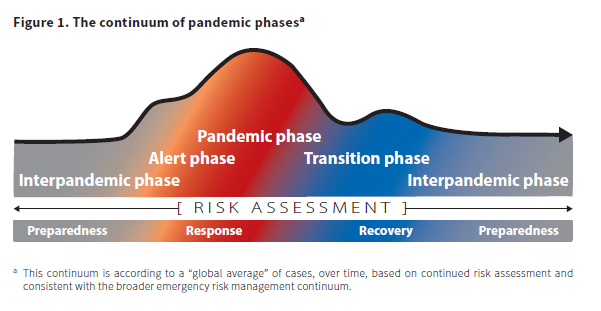
Figure one shows the World Health Organization’s “Continuum of Pandemic Phases,” displayed as a distribution curve of the hypothetical global average of pandemic cases over time based on a continued pandemic risk assessment. From left to right, the curve shows the increase and decrease of the global average of pandemic cases across four phases of the pandemic continuum. The four phases include “interpandemic,” “alert,” “pandemic,” and “transition.” The phases in the continuum also overlap with the stages of the pandemic risk assessment. From left to right, the three stages of the risk assessment include “preparedness,” “response,” and “recovery.” Starting at the far left of the continuum, the global average of cases are lowest during the “interpandemic” phase, which is during the “preparedness” risk assessment stage. The global average of cases greatly increase through the “alert” and “pandemic” phases, with the greatest global average of cases occurring in the “pandemic” phase. These two phases overlap with the “response” stage of the risk assessment. The global average of cases greatly decreases moving into the “transition” phase, which overlaps with the “recovery” stage of the risk assessment. The figure shows a slight increase of the global average of cases during the “transition” phase, indicating a possible second wave of pandemic cases. The global average of cases decreases until it levels out to the original global average of cases, returning to the “interpandemic” phase, which overlaps with the “preparedness” risk assessment stage.
- Page last reviewed: November 3, 2016
- Page last updated: November 3, 2016
- Content source:
- Centers for Disease Control and Prevention, National Center for Immunization and Respiratory Diseases (NCIRD)
- Page maintained by: Office of the Associate Director for Communication, Digital Media Branch, Division of Public Affairs