FluLabSurge 1.0
Download Stand-alone FluLabSurge 1.0 Software Application [12.1 MB]
FluLabSurge is a spreadsheet-based program designed to assist laboratory directors forecast demand for specimen testing during the next influenza pandemic (i.e., the surge in demand), and develop response plans.
Who Should Use FluLabSurge?
FluLabSurge is designed to assist laboratory directors and public health officials. In the event of an Influenza Pandemic, both groups are responsible for running influenza-testing laboratories.
What Does FluLabSurge Produce?
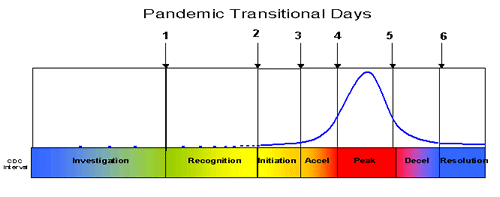
FluLabSurge produces estimates of: a) the daily number of specimens that may be delivered to a laboratory for testing; and b) the testing capacity of that laboratory (e.g., how many samples can be tested per day or work shift) per pandemic transitional day found in each of the pandemic stages. FluLabSurge also helps the user produce a one-page plan showing how capacity will be used to meet user-defined testing goals (e.g., surveillance, strain identification, clinical diagnostics).

What are the FluLabSurge 1.0 Model Components?
FluLabSurge is comprised of three different modules that must be used (i.e. run) in order to produce meaningful results. FluLabSurge allows the user to alter all of the model inputs and also allows the user to consider 1968-type and 1918-type pandemic scenarios.
The three different modules are:
- Workload Demand Module: Predicts the DAILY number of specimens that may be delivered over the course of a pandemic. The number of specimens sent to a lab for testing will depend upon the total number of cases, hospitalizations and deaths. A user can also choose a scenario representing a 1968-type pandemic or a 1918-type pandemic.
- Laboratory Capacity Module: Predicts the average and maximum laboratory testing capacities, using data regarding the number of available personnel and diagnostic machines. The module also allows the user to extensively explore “what if” situations, such as “What if we added more personnel, how many additional test could we run in a given time period?”
- Pandemic Planning Module: Utilizes the data from the other two modules to assist in planning for the next pandemic. The output from this module can be pasted into presentation material and/or reports.
What Types of Output are Produced?
Each module produces their own set of results according to the input values entered in that particular module. Below you will find examples of output that may be produced within each of the three modules.
-
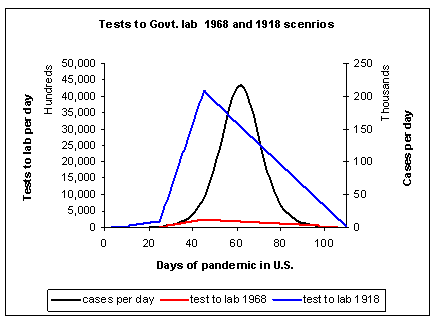
Workload Demand Module: Example of cases-per-day (black line), test sent to lab for a 1968-type pandemic (red line), and specimens sent to lab for 1918-type pandemic (blue line).

-
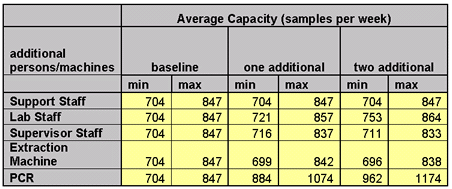
Laboratory Capacity Module: Example of a one-way sensitivity analysis illustrating the impact of adding one or two staff members and/or machines.

-
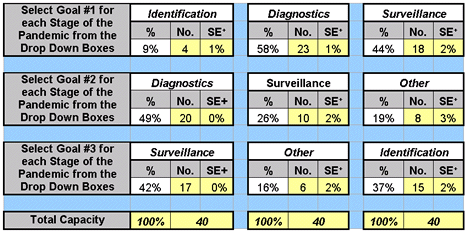
Pandemic Planning Module: Example of a planning report detailing how many specimens may be received in a particular laboratory for the first three stages of a pandemic (investigation, recognition, initiation of response) season. The user selects the goals for the lab capacity (e.g., identification, clinical diagnostics, and surveillance) in each of the stages.

Help Features
On each page of FluLabSurge, you will find a “QuickStart Manual” button. Clicking these buttons will provide pop-up windows containing an overview of information that is presented on that page, such as definitions for inputs and outputs, comments on what values need to be entered, and explanations on how to interpret the results.
System Requirements
FluLabSurge uses the Windows* operating system (Microsoft Windows 2000 or higher) and Excel (Microsoft Office 2000 or higher). We recommend using a computer that has at least a processor with a minimum of 1GB of RAM (operating memory), a 2.5 GHZ speed, and at least 15 MB of free storage memory on the computer’s hard drive.
We have successfully loaded and run FluLabSurge on a variety of desktop and laptop computers using the Windows operating system. FluLabSurge is not designed to run on Apple* or machines that use other operating systems such as Linux.*
*Microsoft Windows and Office are copyrighted products produced by Microsoft Corporation, WA. The use of trade named products is for information purposes only. The U.S. Federal Government or its agencies do not endorse any specific computer or operating system.
Disclaimer
Please keep in mind that this is a test version of the software. The numbers generated through the use of FluLabSurge should not be considered predictions of what will actually occur during a pandemic. Rather, they should be treated as estimates of what could happen.
Additional Information
Users are encouraged to use the “QuickStart Manual” buttons to obtain additional information regarding the use and interpretation of results, as well as comments on the general modeling philosophy used in designing FluLabSurge. In addition to the resources listed in the References section, two scientific papers that address the economic impact of an influenza pandemic can be found at the CDC's Web site, or by clicking on the links provided below:
- Meltzer MI, Cox NJ, Fukuda K. The economic impact of pandemic influenza in the United States: Implications for setting priorities for interventions. Emerg Infect Dis 1999:5(5); 659-671.
- Meltzer MI, Cox NJ, Fukuda K. Modeling the economic impact of pandemic influenza in the United States: Implications for setting priorities for intervention. Background paper.
References
- Ferguson et. al. Strategies for Mitigating an Influenza Pandemic. Nature 2006; 442(7101): 448-452.
- Germann et. al. Mitigation Strategies for Pandemic Influenza in the United States. PNAS 2006; 103:5935-5940.
- DHHS Pandemic Influenza Plan
- Meltzer MI. Basic Instructions and Template of Draft Report: Using FluAid & FluSurge to Estimate the Potential Impact of the next Influenza Pandemic upon Locale Y [467 KB, 42 pages].
Download
Download Stand-alone FluLabSurge 1.0 Software Application [12.1 MB]
- Select “Open” on the file download menu.
- Select “Enable Macros” command button on the Security Warning Screen.
- File is now open and the program is ready to begin.
- Page last reviewed: August 22, 2016
- Page last updated: October 31, 2013
- Content source:
- Centers for Disease Control and Prevention, National Center for Immunization and Respiratory Diseases (NCIRD)
- Page maintained by: Office of the Associate Director for Communication, Digital Media Branch, Division of Public Affairs


 ShareCompartir