

Survey of EMS Practices for Heart Disease and Stroke Oregon Summary of Results
 ShareCompartir
Download this fact sheet [PDF–835K]
Background
Heart and stroke-related deaths are, respectively, the first and fourth leading causes of mortality in the United States and major causes of disability. The most current comprehensive statistics on cardiovascular disease from the American Heart Association, published in February 2011, show that an estimated 82,600,000 American adults (1 in 3) have one or more types of cardiovascular disease. It is estimated that approximately 1,255,000 heart attacks and 795,000 strokes will occur in 2011. Also, statistics show that approximately 1 in 6 deaths are due to coronary heart disease (the most common type of heart disease) and 1 in 18 deaths are due to stroke.1
Approximately half of heart- and stroke-related deaths2 occur before a patient arrives at a hospital, underscoring the important role of pre-hospital emergency medical care in the "chain of survival" for heart attack and stroke. The statistics for cardiac arrest are difficult to pinpoint, but the best estimates are a survival rate of just 7.6%.3 Time to treatment is critical for these patients, and rapid emergency medical services (EMS) response, intervention, and transport to specialized medical facilities is essential for positive patient outcomes. The Institute of Medicine has noted, however, that across the United States, the delivery of emergency care across the health care system is fragmented, which could influence timeliness and quality of care provided for cardiovascular-related emergencies.4
Survey Objectives
In light of the important role of pre-hospital care in the treatment of heart and stroke events, the Division for Heart Disease and Stroke Prevention (DHDSP) at the Centers for Disease Control and Prevention (CDC) conducted a survey of state and local EMS managers to better understand EMS capacity for emergency care of acute cardiovascular events. DHDSP developed this survey as part of its mission to increase early detection and treatment of heart disease and stroke, promote coordinated systems of care policies, enhance collaboration between CDC and state and local agencies, and identify at-risk populations to help eliminate disparities. The survey also serves to inform CDC programs in their designated role to support EMS through the Federal Interagency Committee on EMS (FICEMS).
Survey Response Rates for the 9 Participating States
| State | Percent Responded |
|---|---|
| Florida | 76.7 |
| Massachusetts | 74.8 |
| Kansas | 71.1 |
| Montana | 69.8 |
| New Mexico | 50.2 |
| Wisconsin | 67.6 |
| Oregon | 71.7 |
| South Carolina | 57.4 |
| Arkansas | 60.9 |
EMS Agency Personnel*
| Oregon | All 9 States | |||||
|---|---|---|---|---|---|---|
| Volunteer Staff | Total | Min† | Max‡ | Total | Min† | Max‡ |
| EMT-Basic | 1,554 | 0 | 60 | 8,514 | 0 | 100 |
| EMT-Intermediate | 453 | 0 | 28 | 2,520 | 0 | 60 |
| EMT-Paramedic | 225 | 0 | 10 | 934 | 0 | 50 |
| Paid Staff | ||||||
| EMT-Basic | 893.0 | 0 | 100 | 14,769.6 | 0 | 100 |
| EMT-Intermediate | 519.8 | 0 | 31 | 3,139.3 | 0 | 75 |
| EMT-Paramedic | 1,728 | 0 | 100 | 16,159.9 | 0 | 100 |
* Source: Survey of EMS Practices for Heart Disease and Stroke, 2008.
† The smallest number of staff reported from a single agency.
‡ The largest number of staff reported from a single agency.
EMS Agency Call Volume*
| Oregon | All 9 States | |||||
|---|---|---|---|---|---|---|
| Total | Min† | Max‡ | Total | Min† | Max‡ | |
| Total non-fire | 311,641 | 1 | 40,000 | 4,749,605 | 1 | 130,000 |
| Chest pain | 35,741 | 0 | 2,580 | 453,831 | 0 | 25,200 |
| Cardiac arrest | 5,228 | 0 | 360 | 58,703 | 0 | 2,400 |
| Stroke | 13,844 | 0 | 960 | 143,711 | 0 | 9,600 |
* Source: Survey of EMS Practices for Heart Disease and Stroke, 2008. Results reported are approximate numbers. When respondents reported a range for the number of received calls, an average of the two numbers was reported.
† The smallest number of calls reported from a single agency.
‡ The largest number of calls reported from a single agency.
Survey Description
The survey consisted of 46 questions covering location and characteristics of the service area; basic descriptive information, such as EMS capacity, service levels, and types of care provided; medical direction; heart attack and stroke patient encounters; and transportation protocols. Also included was a list of 18 medical interventions (i.e., medications, devices, and procedures) relevant to emergency medical care for out-of-hospital cardiovascular crises.
The computer-assisted standardized telephone survey was administered by trained interviewers to 1,292 ground-based emergency care agency supervisors in nine states (Florida, Massachusetts, Kansas, Montana, New Mexico, Wisconsin, Oregon, South Carolina, and Arkansas). The response rate for each state ranged from 50.2% to 76.7%. The survey was designed by a team of researchers based on literature reviews and recommendations of a panel of emergency care experts to devise a set of questions relevant to assessing cardiovascular emergency care capabilities.
Results
There are nine separate state summaries—one for each of the states that participated in the survey. Each state summary report provides an overview of the state-specific results and comparison data for all nine states combined. The tables and maps in this summary are survey results from participating EMS agencies in Oregon.
These data will be useful for state and local EMS agencies and policymakers to provide a snapshot of heart- and stroke-related emergency response policies and personnel capabilities as well as highlight the importance of these policies for providing care to residents. These data also will provide a useful planning resource for state and local EMS providers and serve as the basis for continued dialogue with CDC to help the agency better understand the critical care challenges that face EMS and identify ways that CDC can support emergency response for cardiovascular disease.
- Roger VL, Go AS, Lloyd-Jones DM, et al. Heart disease and stroke statistics—2011 update. A report from the Ameri-can Heart Association. Circulation. 2011;123:e18–e209.
- Centers for Disease Control and Prevention. State specific mortality from sudden cardiac death: United States, 1999. MMWR2002;51(6):123–126.
- Sasson C, Rogers MA, Dahl J, Kellerman AL. Predictors of survival from out-of-hospital cardiac arrest: A systematic review and meta-analysis. Circ Cardiovasc Qual Outcomes. 2010;3:63–81.
- Institute of Medicine, Committee on the Future of Emergency Care in the United States Health System. Emergency Medical Services: At the Crossroads. Washington, DC: National Academies Press; 2007.
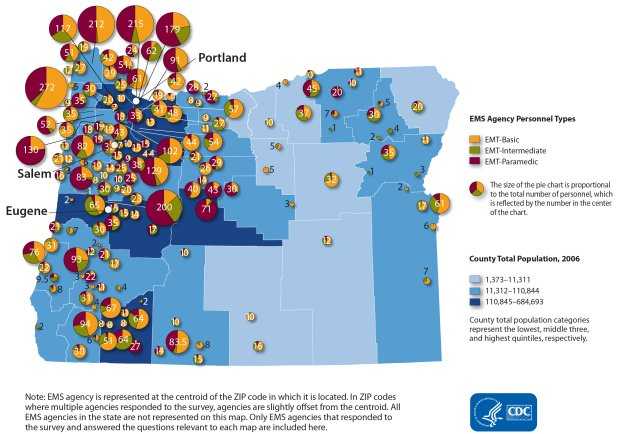
Characteristics of EMS Agencies in Oregon*
EMS Agency Personnel Types
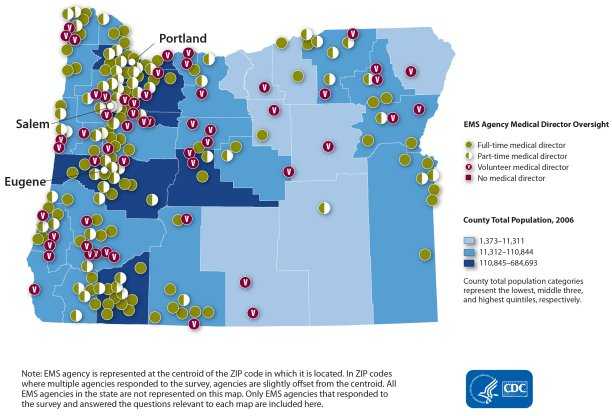
EMS Agency Medical Director Oversight
EMS Scope of Practice for Cardiovascular Events: Percentage of EMS Agencies That Authorize EMTs to Perform Each Intervention*
| Oregon | All 9 States | |||||
|---|---|---|---|---|---|---|
| Interventions | EMT-Basic (%) | EMT-Intermediate (%) | EMT-Paramedic (%) | EMT-Basic (%) | EMT-Intermediate (%) | EMT-Paramedic (%) |
| Thrombolytic agent | 0.5 | 4.3 | 25.0 | 0.6 | 1.6 | 25.1 |
| Morphine or equivalent | 0.5 | 56.6 | 89.3 | 0.5 | 27.7 | 91.6 |
| Surgical airway | 0.5 | 2.4 | 92.0 | 0.6 | 2.2 | 78.8 |
| Beta blocker | 0.0 | 16.8 | 73.2 | 0.6 | 5.6 | 78.2 |
| Anti-arrhythmic medication | 1.0 | 76.5 | 96.4 | 0.7 | 24.0 | 93.2 |
| Pressor agent | 1.0 | 28.9 | 83.6 | 0.8 | 9.9 | 86.3 |
| Central IV | 1.0 | 26.9 | 55.4 | 1.0 | 15.2 | 35.0 |
| Endotracheal intubation | 5.6 | 10.1 | 97.1 | 8.7 | 41.0 | 95.4 |
| Peripheral IV | 1.5 | 97.7 | 97.9 | 9.2 | 93.3 | 97.1 |
| Nitroglycerin from EMT supply | 13.1 | 91.7 | 97.1 | 15.5 | 56.4 | 95.0 |
| 12-lead ECG | 18.2 | 46.2 | 86.4 | 22.8 | 36.7 | 88.2 |
| Monitor end-tidal CO2 | 28.9 | 54.9 | 91.2 | 26.4 | 45.0 | 90.2 |
| Aspirin (ASA) from EMT supply | 71.3 | 97.7 | 98.6 | 63.7 | 80.8 | 98.1 |
| Alternate mechanical airway | 77.6 | 97.7 | 98.6 | 66.7 | 91.9 | 97.0 |
| Glucometry | 94.9 | 100.0 | 99.3 | 83.9 | 95.3 | 98.2 |
| Assistance with patient's nitroglycerin | 93.9 | 94.7 | 95.0 | 86.7 | 91.6 | 93.1 |
| Assistance with patient's aspirin | 95.9 | 97.1 | 98.6 | 87.6 | 91.6 | 94.0 |
| Pulse oximetry | 95.5 | 98.8 | 99.3 | 93.8 | 98.0 | 99.1 |
* Source: Survey of EMS Practices for Heart Disease and Stroke, 2008. In Oregon, 204 EMS agencies participated in the survey. In the total 9 states, 1,292 EMS agencies participated in the survey. However, not all of the respondents answered all questions in the survey. Therefore, the proportions reported may have slightly different denominators. Results displayed are not comprehensive and do not reflect all important characteristics for cardiovascular emergency response.
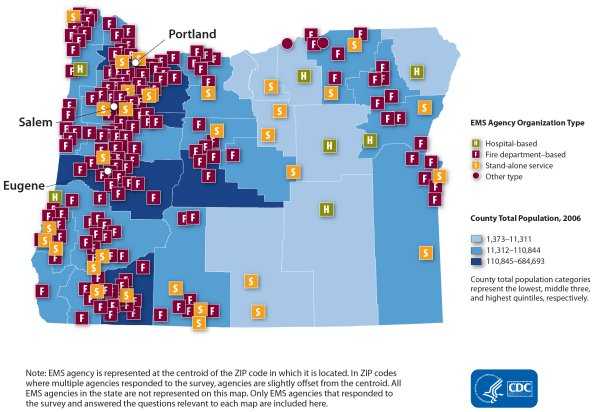
EMS Agency Organization Type
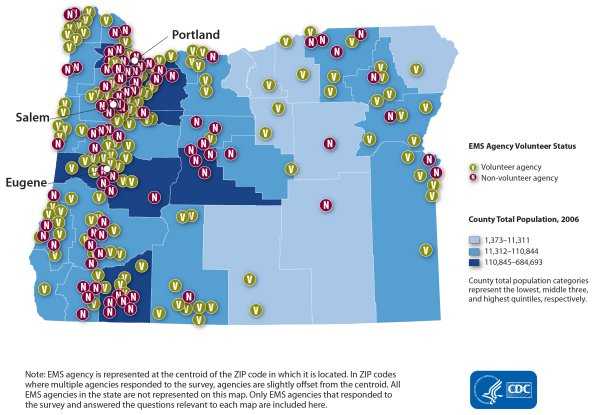
EMS Agency Volunteer Status
EMS Agency Characteristics That Are Important for Cardiovascular Emergency Resonse*
| Oregon | All 9 States | ||||
|---|---|---|---|---|---|
| Number of Agencies that Responded to Survey | 204 | 1,292 | |||
| Count | (%) | Count | (%) | ||
| Location | Rural | 131 | 64.2 | 665 | 51.5 |
| Urban | 73 | 35.8 | 627 | 48.5 | |
| Organization Type | Fire based | 167 | 81.9 | 756 | 58.5 |
| Non-fire based | 37 | 18.1 | 536 | 41.5 | |
| Volunteer Status | Volunteer | 120 | 58.8 | 545 | 42.4 |
| Non-volunteer | 84 | 41.2 | 672 | 55.2 | |
| Medical Director Involvement | Full-time | 81 | 39.9 | 520 | 40.9 |
| Part-time | 66 | 32.5 | 354 | 27.8 | |
| Volunteer | 55 | 27.1 | 383 | 30.1 | |
| No medical director | 1 | 0.5 | 15 | 1.2 | |
| Involvement in past 4 weeks | 84 | 41.6 | 633 | 50.4 | |
| Communication Center | Prioritizes dispatching | 135 | 67.8 | 678 | 54.2 |
| Provides caller with CPR instructions | 182 | 89.2 | 861 | 69.5 | |
| Uses automatic vehicle location technology | 32 | 15.9 | 210 | 16.6 | |
| Highest EMS Level of Life Support | Basic life support | 15 | 9.3 | 187 | 15.6 |
| Intermediate life support | 26 | 16.1 | 187 | 15.6 | |
| Advanced life support | 121 | 74.7 | 828 | 68.9 | |
| Online Immediate Access to Medical Consultation | Always, 24 hours a day, 7 days a week | 174 | 85.3 | 1,155 | 90.3 |
| Sometimes, less than 24 hours a day | 18 | 8.8 | 88 | 6.9 | |
| Never | 12 | 5.9 | 36 | 2.8 | |
| Provides On-Scene Time Benchmark | Chest pain or suspected heart attack | 143 | 71.1 | 1,045 | 82.0 |
| < 15 min | 125 | 88.0 | 914 | 87.7 | |
| > 15 min | 17 | 12.0 | 128 | 12.3 | |
| Cardiac arrest | 125 | 62.5 | 969 | 76.1 | |
| > 15 min | 102 | 82.3 | 806 | 83.4 | |
| > 15 min | 22 | 17.7 | 160 | 16.6 | |
| Stroke | 137 | 68.2 | 1,037 | 81.4 | |
| > 15 min | 122 | 89.7 | 921 | 89.1 | |
| > 15 min | 14 | 10.3 | 113 | 10.9 | |
| Uses Stroke Scale for Diagnosing Stroke | 130 | 65.7 | 1,018 | 80.3 | |
| Patient Information to Receiving Hospital in Advance of Arrival | Yes | 142 | 87.1 | 1,158 | 96.3 |
| No | 21 | 12.9 | 45 | 3.7 | |
| New Therapy or Technology Adopted for Stroke in the Past Year Most common therapies/technologies reported (if specified): Medications for stroke patients New/updated stroke protocol Updated pre-hospital transport policies | 11 | 17.7 | 399 | 31.4 | |
| Funding Basis | Private for-profit | 12 | 6.0 | 102 | 8.0 |
| Private not-for-profit | 12 | 6.0 | 184 | 14.4 | |
| Public/government | 160 | 79.6 | 933 | 72.8 | |
| Public-private partnership | 9 | 4.5 | 62 | 4.8 | |
| System Capabilities | Basic 9-1-1 system | 24 | 11.9 | 160 | 12.6 |
| Enhanced 9-1-1 system | 176 | 87.1 | 1,073 | 84.2 | |
| Other | 2 | 1.0 | 41 | 3.2 | |
* Source: Survey of EMS Practices for Heart Disease and Stroke, 2008. In Oregon, 204 EMS agencies participated in the survey. In the total 9 states, 1,292 EMS agencies participated in the survey. However, not all of the respondents answered all questions in the survey. Therefore, the proportions reported may have slightly different denominators. Results displayed are not comprehensive and do not reflect all important characteristics for cardiovascular emergency response.
- Page last reviewed: July 22, 2014
- Page last updated: July 23, 2013
- Content source: