If the material uses numeric probability to describe risk, is the probability also explained with words or a visual?
A numeric probability is a statement in numbers about the likelihood of an event, such as heart disease causes 1 in 4 deaths, or a patient has a 5% chance of a side effect from a medication.
CDC materials may use numeric probability statements to convey risk from exposures, behaviors or hereditary characteristics. Risk statements that solely rely on numbers may be difficult for audiences to understand. Combine numbers, words and visuals to explain risk statements. People better understand probabilities when they are presented with words and visuals that match and reinforce the meaning of the numbers than when numbers are presented alone.
Generally, people more easily understand:
- natural frequency expressions (1 in 4) than percentages (25%).
- absolute risk (6% chance of a disease) than relative risk (50% less chance of a disease) or number needed to treat (number of people who need a preventive treatment to prevent one case of a disease).
Example 1:
Foodborne illness, sometimes called food poisoning, is common. Each year, about 1 in 6 Americans (or 48 million people) gets sick.

This visual helps people to better understand the risk statement of 1 in 6 people get sick.
Example 2:

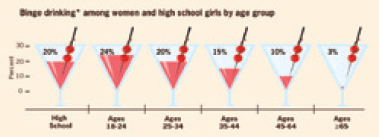
This visual combined numbers, words and visuals to explain binge drinking risks by age group.
Supported by the CDC Style Guide: Visuals are often the most effective way to display large sets of numbers or data.
Resources
Supporting Plain Language Guideline: Organize to meet your readers’ needs.
- Page last reviewed: September 2, 2015
- Page last updated: September 2, 2015
- Content source:
- Centers for Disease Control and Prevention
- Page maintained by: Office of Associate Director of Communication, Division of Public Affairs


 ShareCompartir