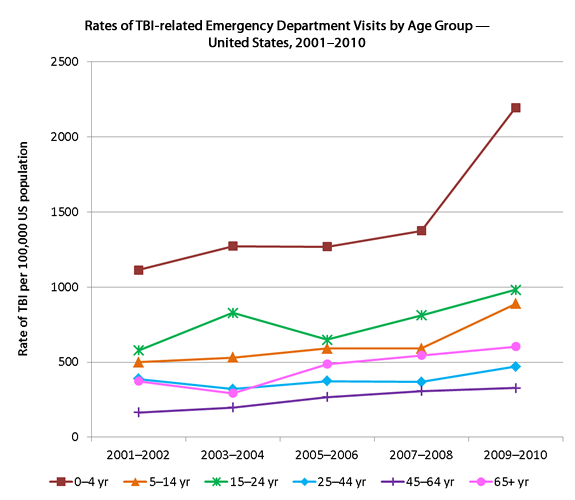
Rates of TBI-related Emergency Department Visits by Age Group — United States, 2001–2010
Rates of TBI-related ED visits increased for all age groups from the period of 2001–2002 through 2009–2010. The rates of TBI-related ED visits increased the most for youth four years of age and younger. From 2007–2008 to 2009–2010, the rates of TBI-related ED visits in this group increased by more than 50% from 1374.0 to 2193.8 per 100,000. Children 0 to 4 years of age had the highest rates of any age group, typically with almost twice the rate of those in the next highest age group (15–24 year-olds).

| 0–4 yr | 5–14 yr | 15–24 yr | 25–44 yr | 45–64 yr | 65+ yr | |
|---|---|---|---|---|---|---|
| 2001–2002 | 1112.6 | 498.8 | 576.9 | 388.3 | 164.8 | 373.1 |
| 2003–2004 | 1272.3 | 529.8 | 827.5 | 320.3 | 197.3 | 293.3 |
| 2005–2006 | 1268.3 | 591.4 | 648.3 | 373.0 | 267.0 | 485.8 |
| 2007–2008 | 1374.0 | 590.2 | 811.3 | 366.7 | 307.4 | 544.7 |
| 2009–2010 | 2193.8 | 888.7 | 981.9 | 470.0 | 328.2 | 603.3 |
Source:
- National Hospital Ambulatory Medical Care Survey — United States, 2001–2010 (Emergency Department Visits)
- Page last reviewed: January 22, 2016
- Page last updated: January 22, 2016
- Content source:
- Centers for Disease Control and Prevention,
- National Center for Injury Prevention and Control,
- Division of Unintentional Injury Prevention


 ShareCompartir
