

Percent Distributions of TBI-related Hospitalizations by Age Group and Injury Mechanism — United States, 2006–2010
 ShareCompartir
The injury mechanisms (external causes of injury) associated with TBI-related hospitalizations vary by age group. As with ED visits, falls account for the majority of TBI-related hospitalizations in those 0–4 years and 65 years and older. The proportion of TBI-related hospitalizations due to motor vehicle traffic-related crashes increase through age 44 before decreasing beginning at ages 45–64 years. Young adults 15–24 have the highest proportion of TBI-related hospitalizations due to motor vehicle traffic-related events.
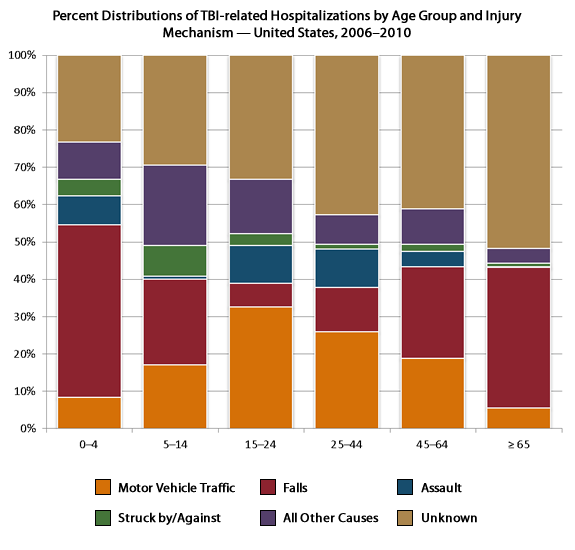
| Motor Vehicle Traffic | Falls | Assault | Struck by/Against | All Other Causes | Unknown | |
|---|---|---|---|---|---|---|
| 0–4 | 1,116 | 6,184 | 1,044 | 589 | 1,327 | 3,123 |
| 5–14 | 2,306 | 3,077 | 111 | 1,118 | 2,887 | 3,976 |
| 15–24 | 13,257 | 2,590 | 4,131 | 1,230 | 5,949 | 13,517 |
| 25–44 | 15,522 | 7,045 | 6,134 | 777 | 4,670 | 25,539 |
| 45–64 | 12,178 | 15,962 | 2,668 | 1,296 | 6,091 | 26,775 |
| ≥ 65 | 5,282 | 36,525 | 285 | 912 | 3,774 | 50,197 |
Source:
- National Hospital Discharge Survey — United States, 2001–2010 (Hospitalizations)

- Page last reviewed: January 22, 2016
- Page last updated: January 22, 2016
- Content source:
- Centers for Disease Control and Prevention,
- National Center for Injury Prevention and Control,
- Division of Unintentional Injury Prevention