Skip directly to search Skip directly to A to Z list Skip directly to navigation Skip directly to page options Skip directly to site content

Help: Explore by Indicator

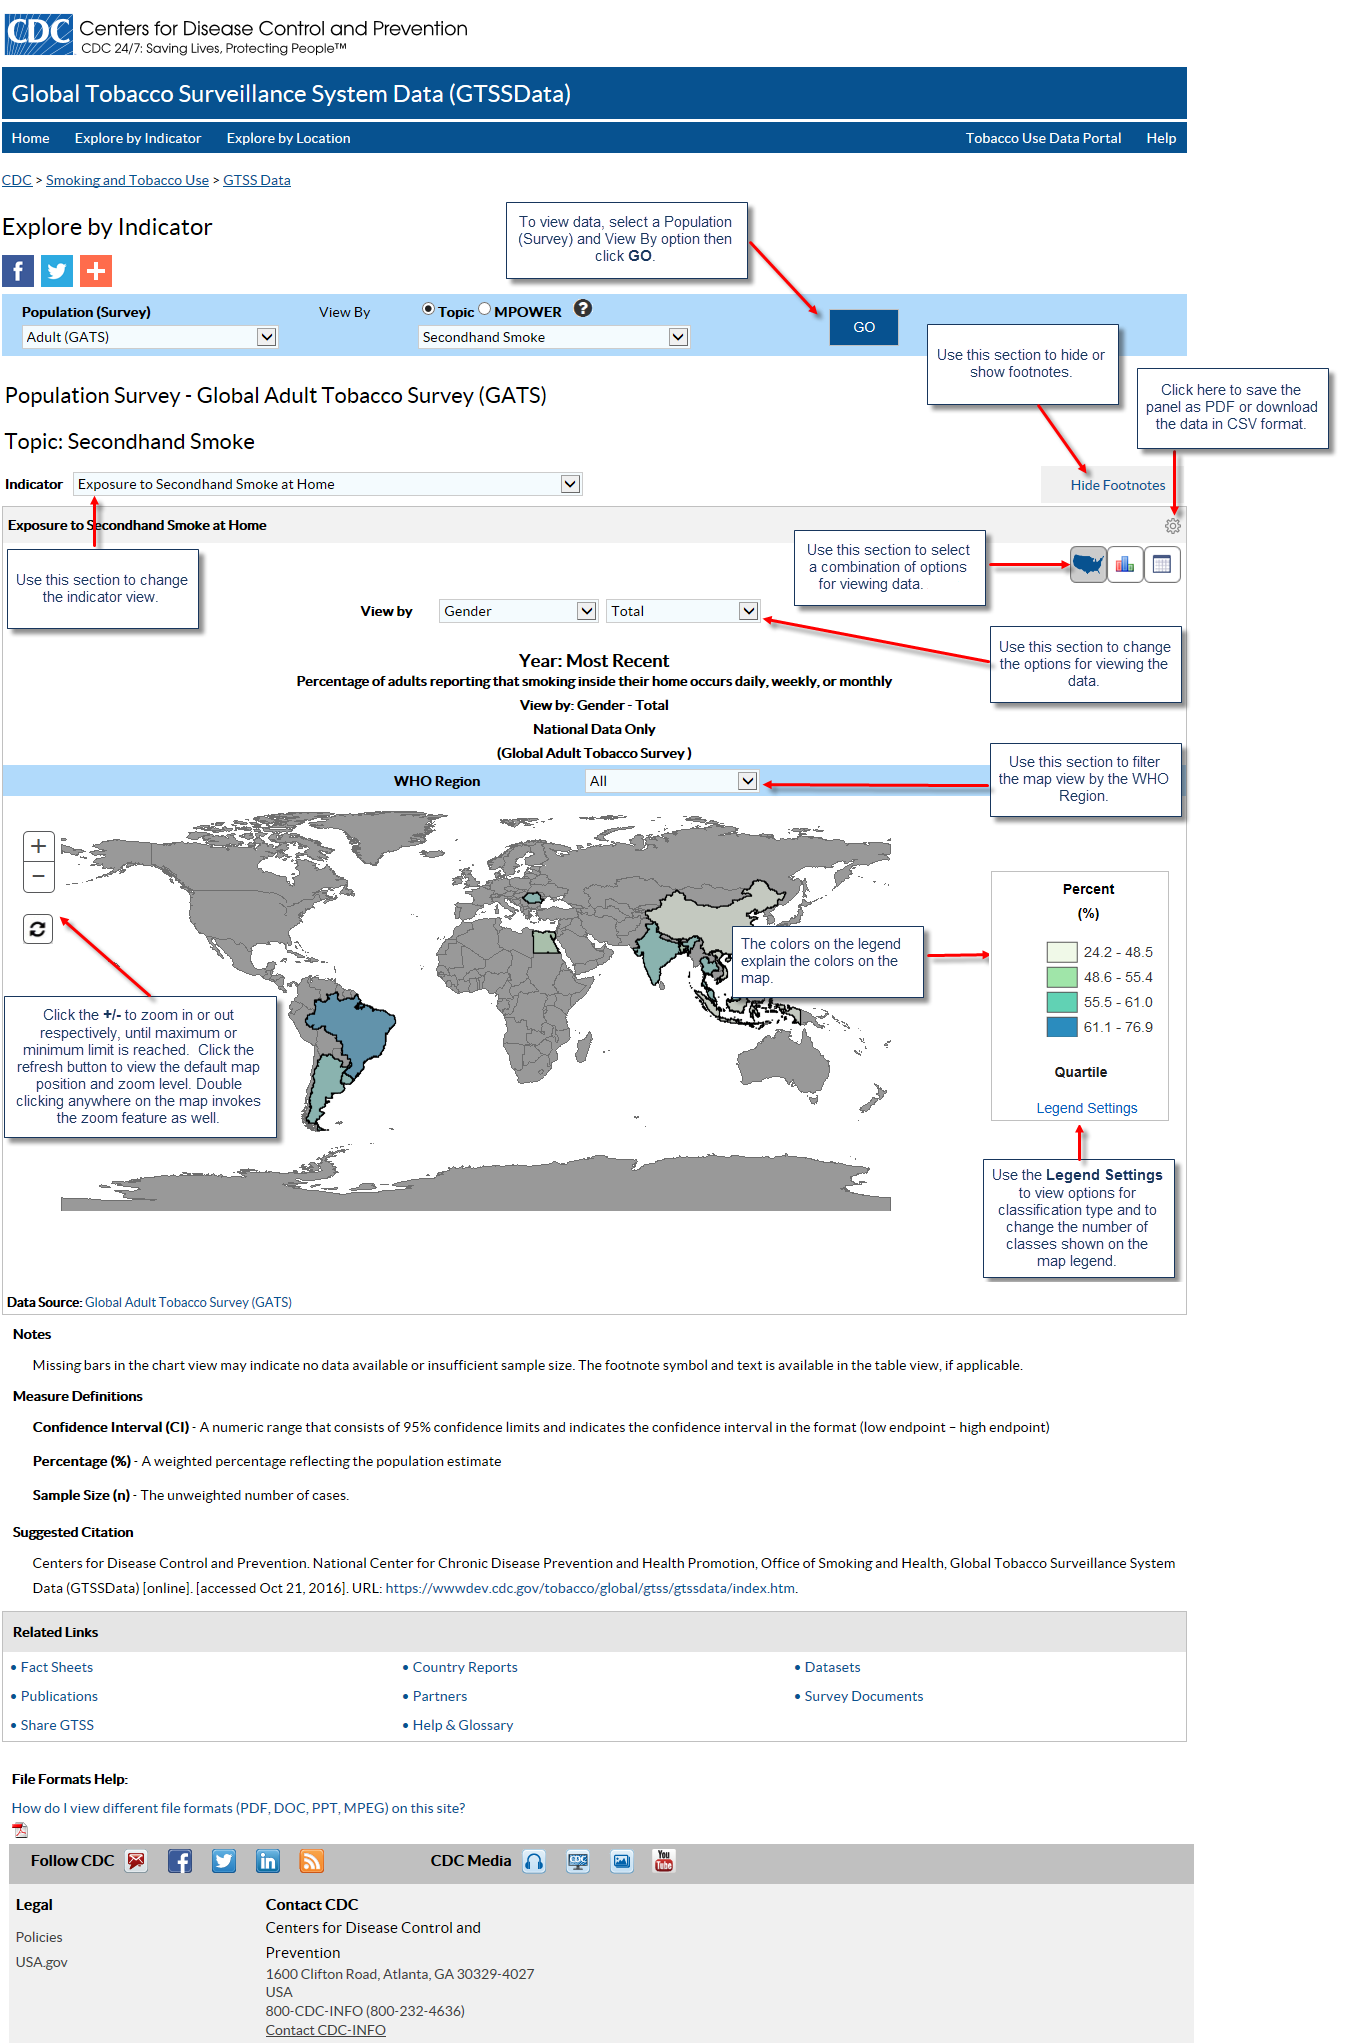
The Explore by Indicator page allows you to view one indicator across all available locations. You can use the View By field to further stratify data. To begin, select a Population (Survey) and View By option then click GO. By default, the system displays the indicator data in map format. You can then choose to view the data in chart or table format.
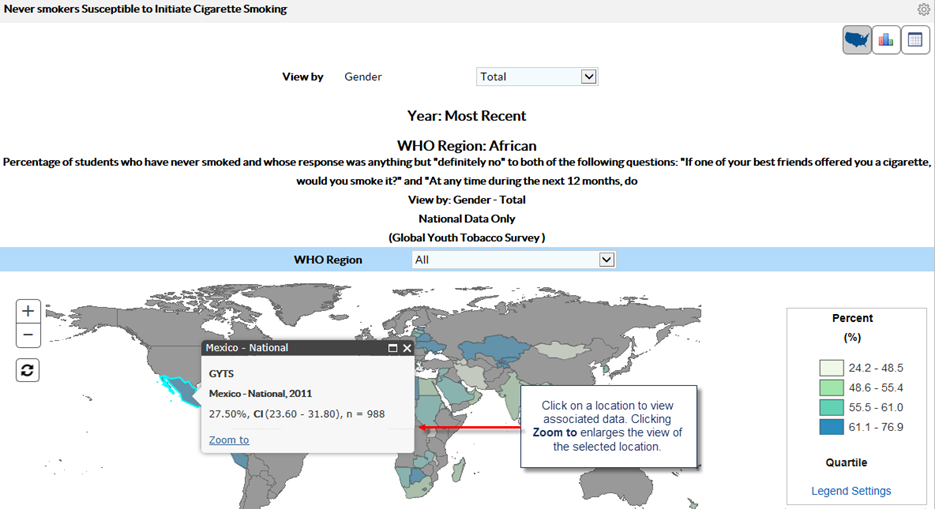
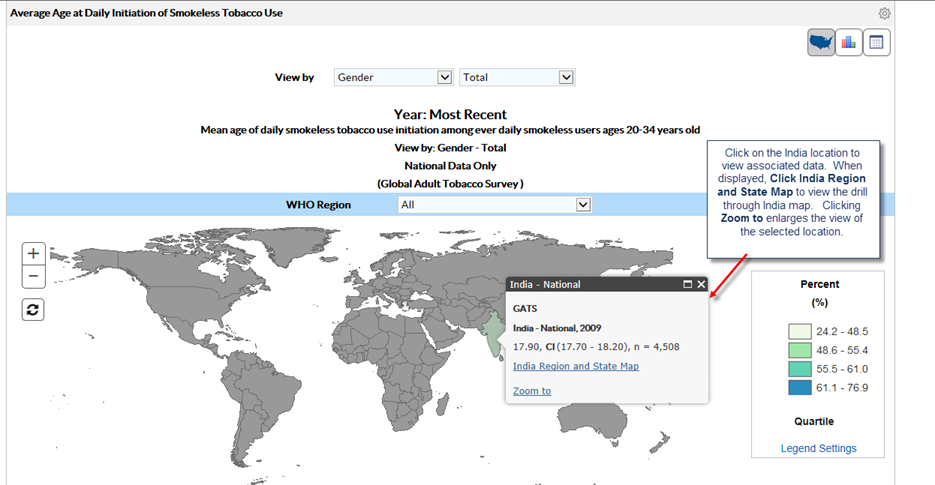
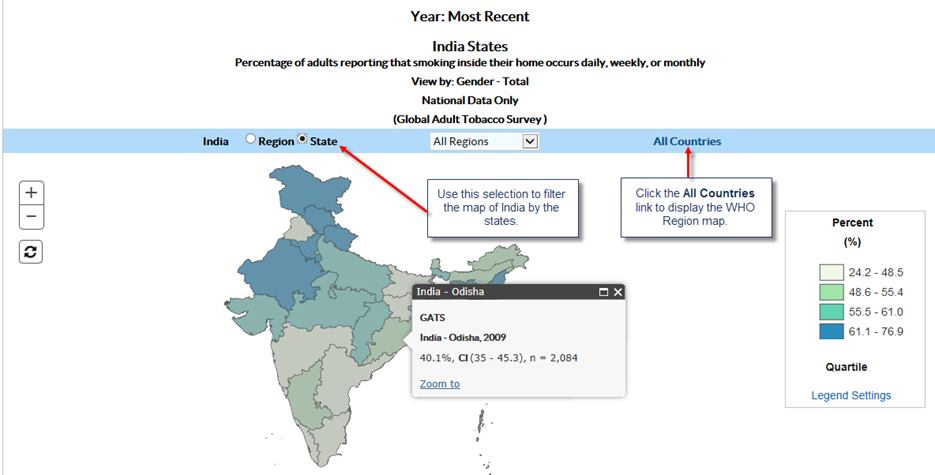
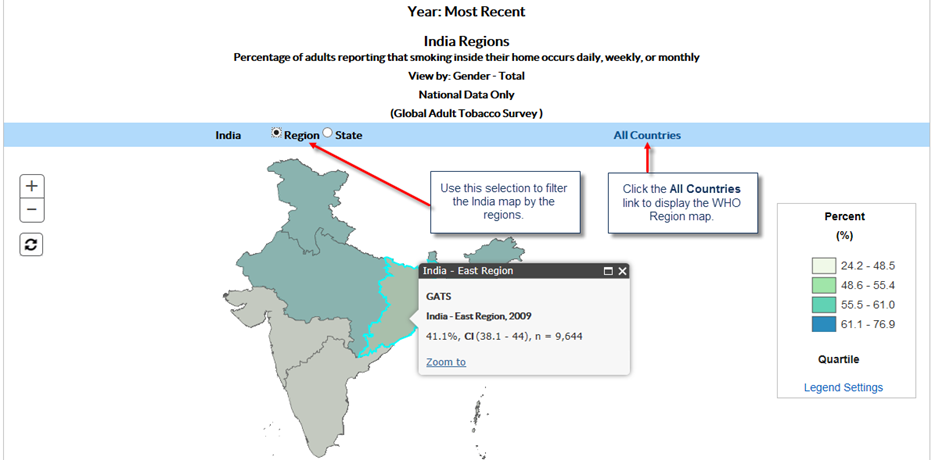
Viewing a map

After selecting a category, a color-coded map displays the indicator data. A legend explaining the colors is displayed to the right of the map.
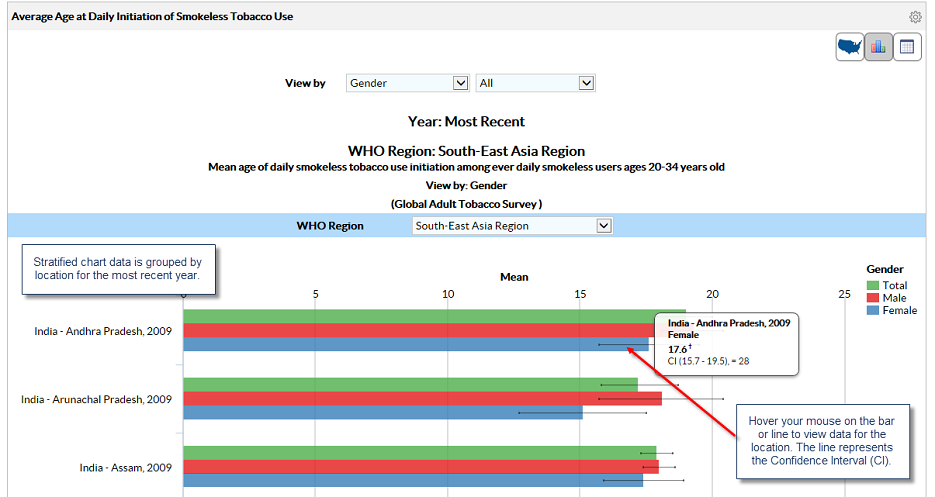
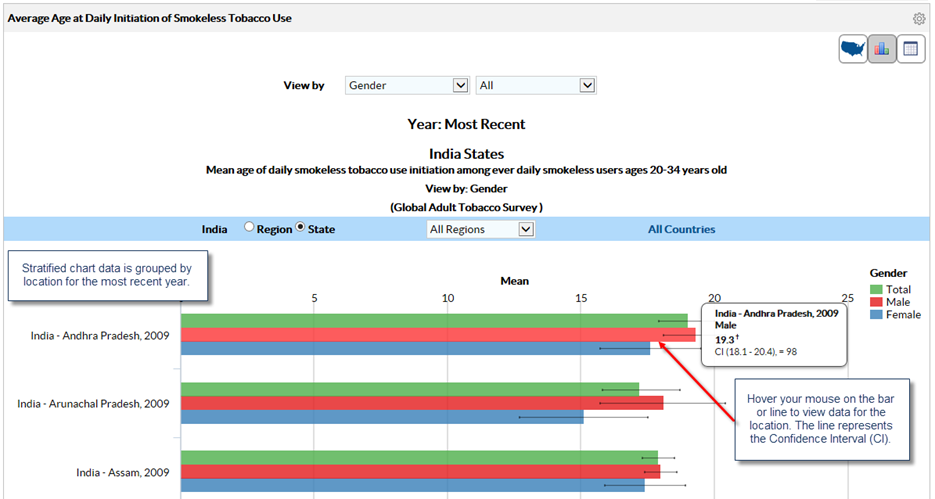
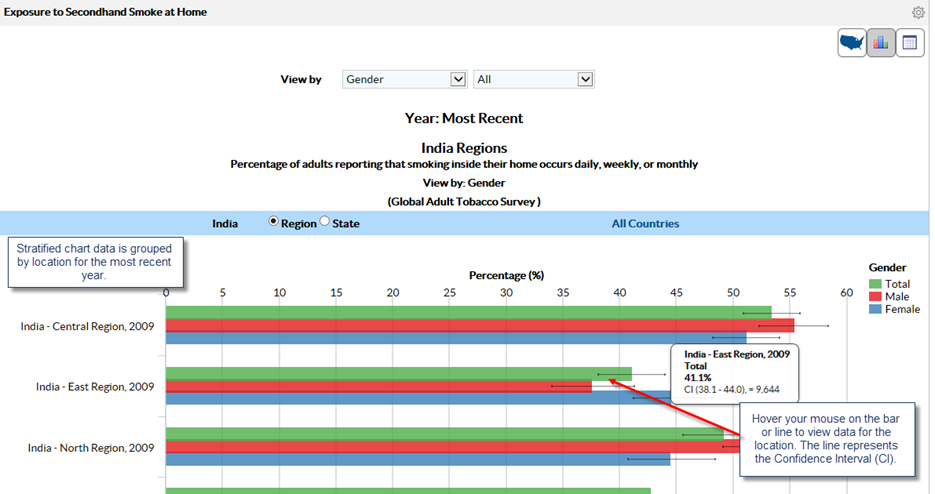
 

1. To view data, select a Population (survey) and View By option then click GO. 2. Use this section to hide or show footnotes. 3. Click here to save the panel as PDF or download the data in CSV format. 4. Use this section to change the indicator view. 5. Use this section to select a combination of options for viewing data. 6. Use this section to change the options for viewing the data. 7. Use this section to filter the map view by the WHO region. 8. Click the +/- to zoom in or out respectively, until maximum or minimum limit is reached.  Click the refresh button to view the default map position and zoom level.  Double clicking anywhere on the map invokes the zoom feature as well. 9. The colors on the legend explain the colors on the map. 10. Use the Legend Settings to view options for the classification type and to change the number of classes shown on the map legend.


Click on a location to view associated data. Clicking 'Zoom to' enlarges the view of the selected location.


Click on the India location to view associated data. When displayed, click 'India Region and State Map' to view the drill through India map. Clicking 'Zoom to' enlarges the view of the selected location.


1. Use this selection to filter the map of India by the states. 2. Click the All Countries link to display the WHO Region map.


1. Use this selection to filter the India map by the regions. 2. Click the All Countries link to display the WHO Region map.


 Top of Page


Viewing a chart

You can view data in a bar chart format by clicking the Chart icon next to the Table icon.


1. Stratified chart data is grouped by location for the most recent year. 2. Hover your mouse on the bar or line to view data for the location. The line represents the Confidence Interval (CI).


1. Stratified chart data is grouped by location for the most recent year. 2. Hover your mouse on the bar or line to view data for the location. The line represents the Confidence Interval (CI).


1. Stratified chart data is grouped by location for the most recent year. 2. Hover your mouse on the bar or line to view data for the location. The line represents the Confidence Interval (CI).


 Top of Page


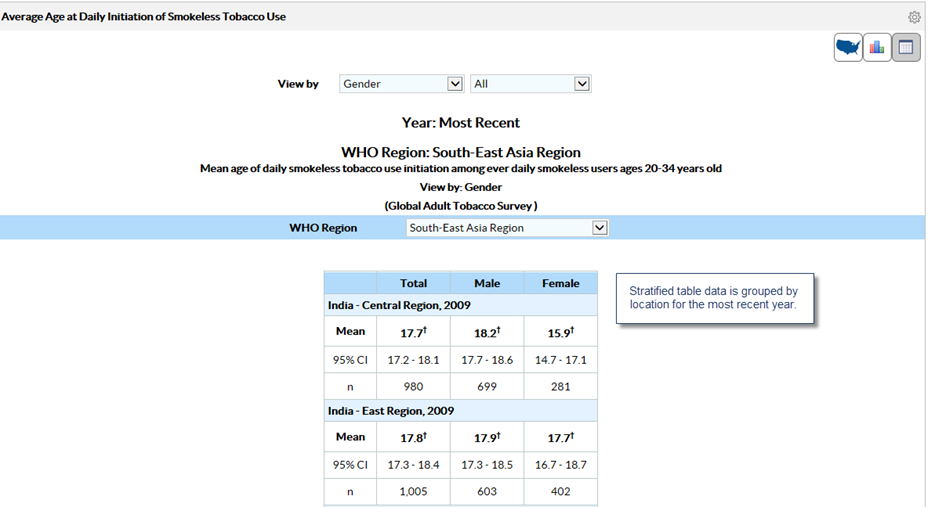
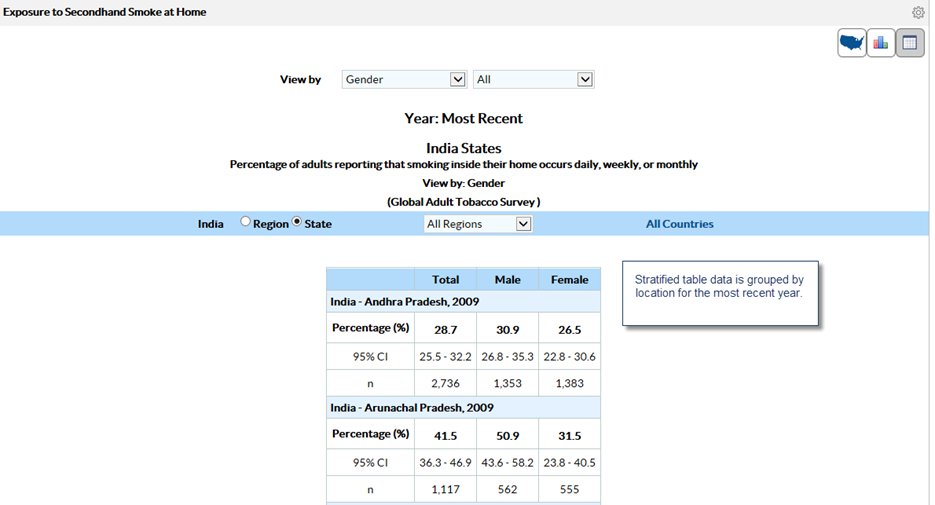
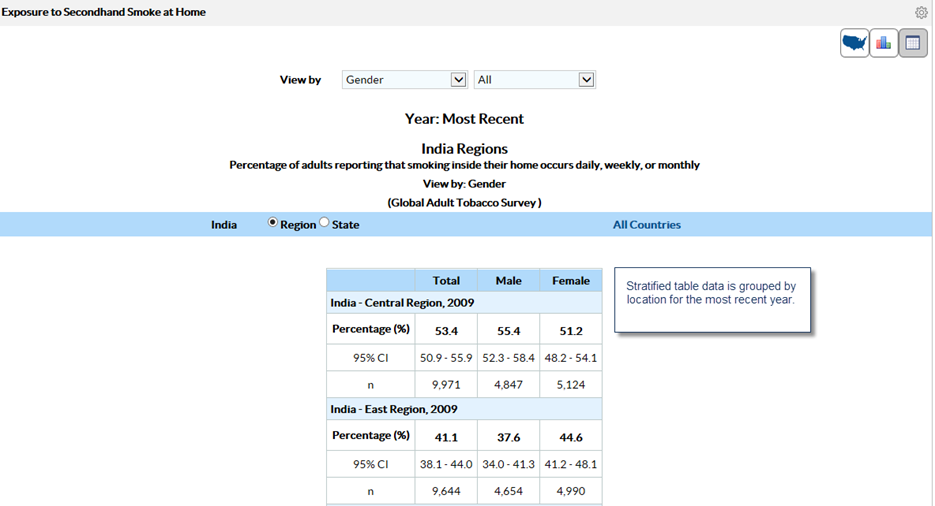
Viewing data in table format

You can view data in table format by clicking the Table icon next to the Chart icon.


1. Stratified table data is grouped by location for the most recent year.


Stratified table data is grouped by location for the most recent year.


Stratified table data is grouped by location for the most recent year.


 Top of Page

Footnotes/Data Source

The Footnotes and Data Source section at the bottom of the data display area provides more information for the content displayed in the panel. This section explains the symbols displayed on the page, and lists the data source. To hide this section, click the Hide Footnotes link, to display it again, click the Show Footnotes link.

 Top of Page

Measure Definitions

The Measure Definitions section provides a description for the measures that are used on the page.

 Top of Page

Suggested Citation

The Suggested Citation section provides reference information for the information displayed on the page.

 Top of Page

Related Links

The Related Links section contains links to other sites on the Web. When you click these links, the system takes you to the related sites. These sites are not contained within the GTSSData system.

 Top of Page


Multimedia

Top