

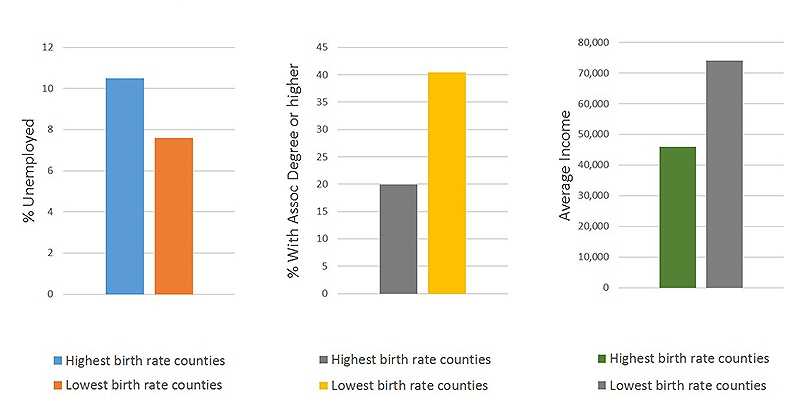
Series of three bar charts showing three different less favorable socioeconomic conditions (high unemployment, low education, and low income) and each condition’s association with high teen birth rates counties.
 ShareCompartir
Series of three bar charts showing three different less favorable socioeconomic conditions (high unemployment, low education, and low income) and each condition’s association with high teen birth rates counties.
Chart 1:
Percent unemployed in counties with the highest birth rates: 10.5
Percent unemployed in counties with the lowest birth rates: 7.6
Chart 2:
Percent with an associate’s degree or higher in counties with the highest birth rates: 19.9
Percent with an associate’s degree or higher in counties with the lowest birth rates: 40.4
Chart 3:
Average annual income in counties with the highest birth rates: $46,005
Average annual income in counties with the lowest birth rates: $73,967
- Page last reviewed: April 5, 2016
- Page last updated: April 5, 2016
- Content source: