

Line chart of teen birth rates (live births per 1,000 females aged 15–19 years) for all races, and specifically for whites, blacks, and those of Hispanic ethnicity in the United States, 2006 – 2014
 ShareCompartir
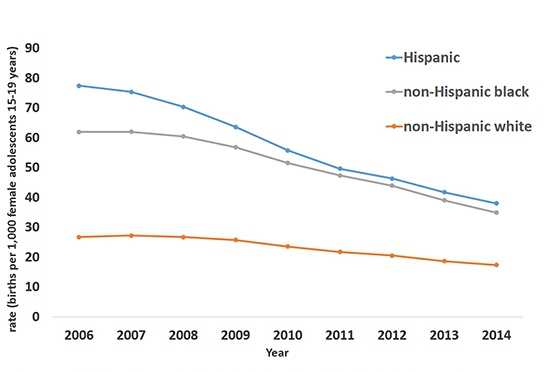
Line chart of teen birth rates (live births per 1,000 females aged 15–19 years) for all races, and specifically for whites, blacks, and those of Hispanic ethnicity in the United States, 2006 – 2014.
All
2006, 41.1
2007, 41.5
2008, 40.2
2009, 37.9
2010, 34.2
2011, 31.3
2012, 29.4
2013, 26.5
2014, 24.2
White (non-Hispanic)
2006, 26.7
2007, 27.2
2008, 26.7
2009, 25.7
2010, 23.5
2011, 21.7
2012, 20.5
2013, 18.6
2014, 17.3
Black
2006, 61.9
2007, 62.0
2008, 60.4
2009, 56.8
2010, 51.5
2011, 47.3
2012, 43.9
2013, 39.0
2014, 34.9
Hispanic
2006, 77.4
2007, 75.3
2008, 70.3
2009, 63.6
2010, 55.7
2011, 49.6
2012, 46.3
2013, 41.7
2014, 38.0
- Page last reviewed: April 5, 2016
- Page last updated: April 5, 2016
- Content source: