

Birth Rates (Live Births) per 1,000 Females Aged 15-19 Years, by Race and Ethnicity, 2007-2015
 ShareCompartir
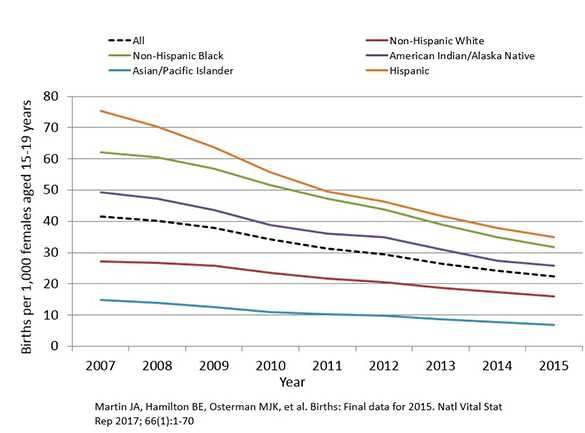
Line chart of birth rates (live births) per 1,000 females aged 15–19 years for all races and Hispanic ethnicity in the United States, 2007–2015.
All
2007, 41.5
2011, 31.3
2012, 29.4
2013, 26.5
2014, 24.2
2015, 22.3
White (non-Hispanic)
2007, 27.2
2011, 21.7
2012, 20.5
2013, 18.6
2014, 17.3
2015, 16
Black (non-Hispanic)
2007, 62.0
2011, 47.3
2012, 43.9
2013, 39.0
2014, 34.9
2015, 31.8
American Indian/Alaska Native
2007, 49.3
2011, 36.1
2012, 34.9
2013, 31.1
2014, 27.3
2015, 25.7
Asian/Pacific Islander
2007, 14.8
2011, 10.2
2012, 9.7
2013, 8.7
2014, 7.7
2015, 6.9
Hispanic
2007, 75.3
2011, 49.6
2012, 46.3
2013, 41.7
2014, 38
2015, 34.9
- Page last reviewed: May 4, 2017
- Page last updated: May 4, 2017
- Content source: