Chlamydia Figures
 ShareCompartir
This web page is archived for historical purposes and is no longer being updated. Newer data is available on the STD Data and Statistics page.
 Figure 1. Chlamydia — Rates of Reported Cases by Sex, United States, 2000–2015
 Figure 2. Chlamydia — Rates of Reported Cases by Region, United States, 2006–2015
 Figure 3. Chlamydia — Rates of Reported Cases by State, United States and Outlying Areas, 2015
 Figure 4. Chlamydia — Rates of Reported Cases by County, United States, 2015
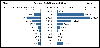 Figure 5. Chlamydia — Rates of Reported Cases by Age Group and Sex, United States, 2015
 Figure 6. Chlamydia — Rates of Reported Cases by Race/Ethnicity, United States, 2011–2015
 Figure 7. Chlamydia — Reported Cases Among Men by Reporting Source, United States, 2006–2015
 Figure 8. Chlamydia — Reported Cases Among Women by Reporting Source, United States, 2006–2015
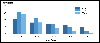 Figure 9. Chlamydia — Proportion of STD Clinic Patients Testing Positive by Age Group, Sex, and Sexual Behavior, STD Surveillance Network (SSuN), 2015
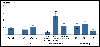 Figure 10. Chlamydia — Prevalence Among Persons Aged 14–39 Years by Sex, Race/Ethnicity, or Age Group, National Health and Nutrition Examination Survey, 2007–2012
 Figure 11. Chlamydia — Prevalence Among Sexually-Active Women Aged 14–39 Years by Race/Ethnicity and Age Group, National Health and Nutrition Examination Survey, 2007–2012
- Page last reviewed: October 17, 2016 (archived document)
- Content source:


This web page is archived for historical purposes and is no longer being updated. Newer data is available on the STD Data and Statistics page.