

Figure 7. Chlamydia — Reported Cases Among Men by Reporting Source, United States, 2006–2015
 ShareCompartir
This web page is archived for historical purposes and is no longer being updated. Newer data is available on the STD Data and Statistics page.
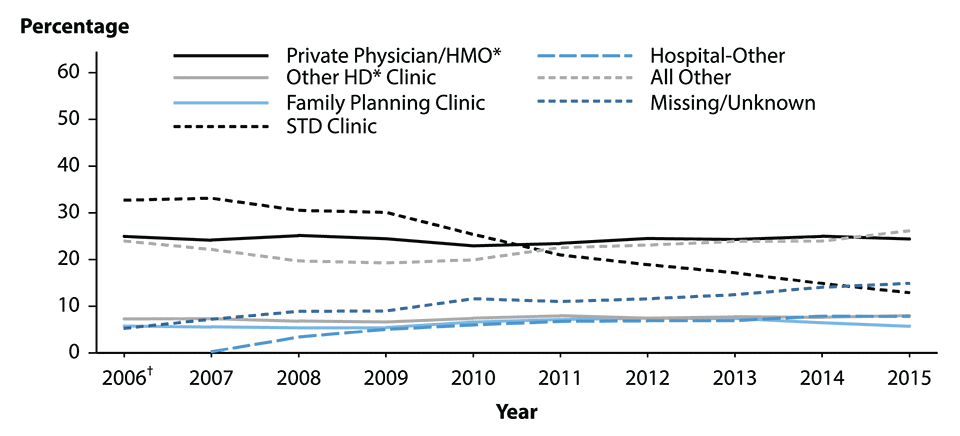
* HMO = health maintenance organization; HD = health department.
† The variable “Hospital-Other” (i.e., other hospital clinics/facilities) was not added as a response option for reporting source until calendar year 2007; therefore, there are no data available for the “Hospital-Other” variable in 2006.
NOTE: All Other includes: Drug Treatment, Tuberculosis Clinic, Correctional Facility, Laboratory, Blood Bank, Labor and Delivery, Prenatal Care, National Job Training Program, School-based Clinic, Mental Health Provider, Indian Health Service, Military, Emergency Room, and HIV Counseling and Testing Site.
- Page last reviewed: October 17, 2016 (archived document)
- Content source: